Improving Patient Perception of Clinical Services Through Real-Ear Measurements
REM builds patient loyalty and is viewed as valuable to a wide range of patients

Published on November 22, 2016. Reprinted with permission from: Hearing Review
Verification, namely probe-microphone or real-ear measures (REMs), is one aspect of service delivery that has not been consistently embraced as a part of the profession’s standard of care. In fact, surveys on the clinical use of REMs range between 20% and 50%,1-3 despite evidence-based recommendations from audiology professional organizations.4,5
Mueller,6 for example, reported that 78% of audiologists who dispensed hearing aids routinely programmed the devices to either the NAL or DSL prescriptive method. Of this group, only 44% routinely used REMs to verify gain and output at the listener’s eardrum. This finding assumes that the remaining 56% trust the manufacturer’s software (ie, Quick-fit) to provide accurate information. Unfortunately, several studies have shown that the Quick-fit approach does not mimic the prescriptive taget,7,8 with gain differing by as much as ±10 dB at a given frequency.
This disparity between what the hearing aid is providing via Quick-fit and what the hearing aid should be providing when REMs are performed is likely a primary factor for the low adoption rate and increased stigma towards hearing aid use. In fact, it could be reasoned that the lack of REM use as a standard clinical procedure is a catalyst for the recent recommendations by the President’s Council of Advisors on Science and Technology (PCAST)9 and the National Academy of Sciences, Engineering, and Medicine (NAS)10 to establish a new category of over-the-counter, wearable devices.
In the present study, we evaluated the impact of REMs on consumer satisfaction and, indirectly, loyalty as a means to learn whether consumers perceived REMs as a key service component during the hearing aid fitting process. To achieve this objective, we quantified the perceived value of fitting to manufacturer’s Quick-fit specifications with no additional service provision versus an individualized hearing aid fitting accompanied by the service provision of REMs in three different groups of patients commonly seen in the clinic. The study findings are remarkably positive and bear serious consideration by those clinicians still unconvinced of the merits of REMs.
Methods
Participants. Three groups of participants were recruited, with each group consisting of 20 listeners:
- “Experienced” group consisted of experienced users of amplification (ie, >1 year of use, device use exceeds 8 hours/daily).
- “In-the-Drawer” group who had previously purchased amplification, but did not use their devices (ie, hearing aids purchased within the past 2 years, but used less than 8 hours weekly).
- “First-time” users of amplification, who experience hearing difficulties, yet had never attempted a trial period with amplification.
Each participant was recruited from the greater Dallas-Fort Worth (DFW) metropolis. Study participation across groups was based on the following criteria: 1) Aged between 50 and 75 years; 2) Exhibit a symmetrical, bilateral mild-to-moderate sensorineural hearing loss; 3) Annual household income of less than $42,000; and 4) Pass a cognitive screening task (ie, Mini-Mental State Exam).11
The mean age of participants was 66.8 years (SD = 5.2; 8 males, 12 females), 66.2 years (SD = 4.9; 13 males, 7 females), and 68.5 years (SD = 7.3; 10 males, 10 females), for the Experienced, In-the-Drawer, and First-Time groups, respectively. Mean audiometric data for each respective group are shown in Figure 1.
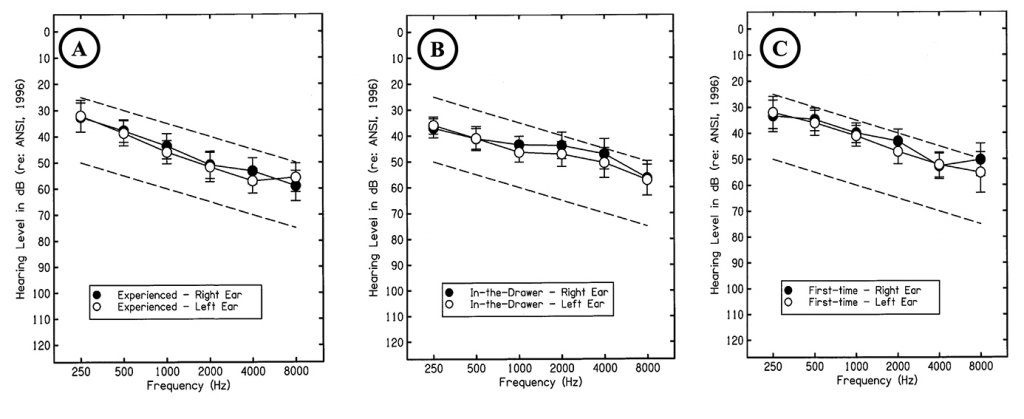
Figure 1. Target audiometric threshold range (ie, dashed lines) used to recruit participants and mean audiometric threshold data, denoted by the filled (ie, right ear) and open (ie, left ear) circles, for: A) Experienced group, B) In-the-Drawer group, and C) First-time users.
Hearing Aid. To control for electroacoustic differences between hearing aid brands and models, each participant was fit binaurally with a commercially available premium model receiver-in-the-canal (RIC) hearing aid from one manufacturer. This multi-memory hearing aid provides digital wide-dynamic range compression (WDRC), along with speech enhancement, omni- and directional-microphone, feedback management, and noise reduction processed in 15 channels. During the study, all advanced features (eg, noise reduction) were disabled, and target gain was generated using the NAL-NL2 prescriptive approach12 in a single memory.
Surveys. Participant responses regarding the service provision of hearing aid verification were quantified using two surveys: 1) Willingness-to-pay (WTP), and 2) SERVAL, a modified version of the PERVAL13 that quantifies the perceived value of service provision.
WTP. WTP is a one-item question that indicates the maximum dollar amount an individual is willing to exchange to obtain a product or service. Prior to administering this survey, we provided each participant with a price anchor of $250 for professional services. The $250 anchor was derived from a pilot study indicating that this value was the average hourly rate in a US audiology clinic.
SERVAL. Each respondent’s perceived value towards verification was measured using the PERVAL-Service Scale (SERVAL). SERVAL is a modified version of the PERVAL Measurement Scale, previously used by Amlani,13 and also includes dimensions reported by Petrick.14 SERVAL, as used in this study, is a 14-item scale that measures attitude and behavior toward perceived value in five dimensions: emotion, perceived quality, price, perceived value, and behavioral intent. During the experiment, participants were asked to provide a categorical response ranging from 1 (strongly agree) to 7 (strongly disagree) for each question item. Response ratings closer to 1 indicated a positive perceived value, while responses closer to 7 indicate a negative perceived value. Questions 2, 4, 5, 7, and 10 were reversed (ie, 1 = strongly disagree; to 7 = strongly agree) to reduce response bias.
Procedures
Each potential participant was provided a University of North Texas Institutional Review Board (UNT-IRB) approved consent form prior to participation. Each consenting participant was tested for air- and bone-conduction thresholds, immittance measures, word-recognition performance, and the cognitive screening task. Once participants met the study requirements, they were placed into one of the three groups (Experienced, In-the-Drawer, and First-Time). Figure 2 shows the procedures used in this study for the Experienced and In-the-Drawer groups (Figure 2a), and the First-Time group (Figure 2b).
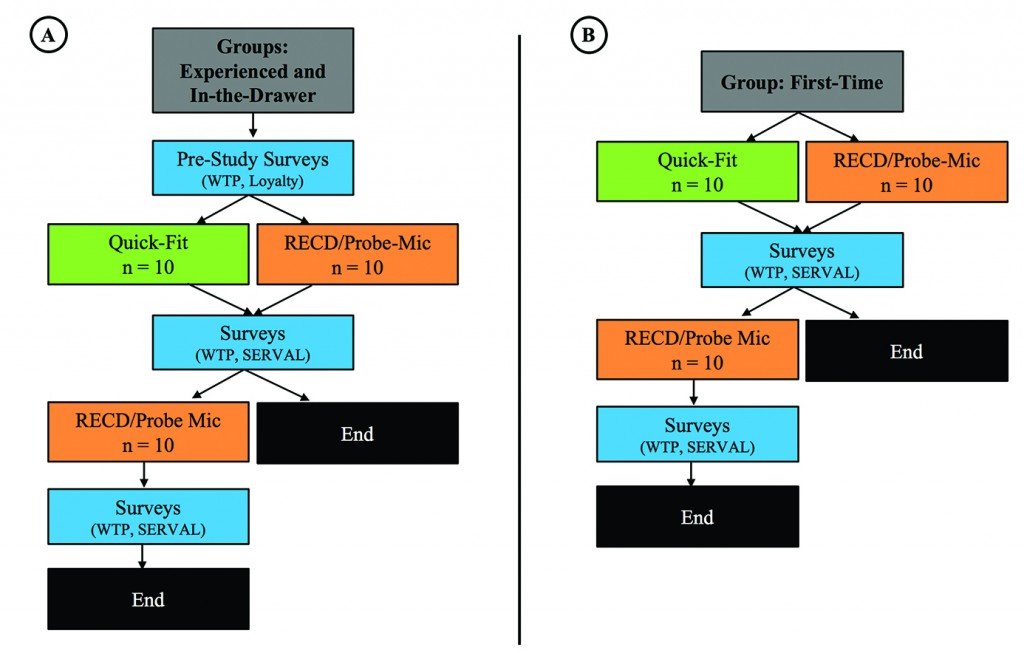
Figure 2. Procedures used in this study. Panel A depicts the procedures provided to participants in the Experienced and In-the-Drawer groups, and Panel B shows procedures provided to participants in the First-time group.
Pre-study. A total of 10 participants within a given group were selected randomly to receive clinical services and amplification programmed using the Quick-fit (ie, hearing aid manufacturer first-fit) protocol, while the remaining 10 participants within the same given group received clinical services and amplification programmed using the probe-microphone real-ear measurements protocol (ie, Verifit Speechmap protocol).15 For participants in the Experienced and In-the-Drawer groups, who had previously experienced professional services related to amplification, we obtained their WTP towards their previous experience. Assessing these subjective measures prior to the experiment provided us with each group’s predisposed attitude and intention towards professional services. Table 1 demonstrates the previous “verification” experience encountered by participants in the Experienced and In-the-Drawer groups.
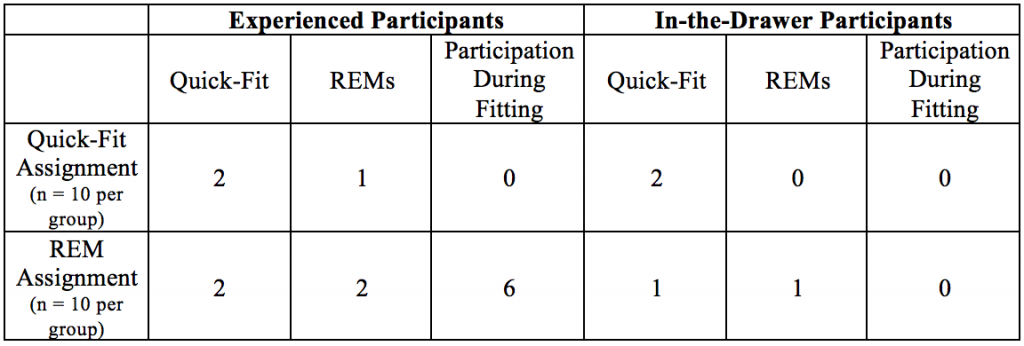
Table 1. Participant recollection about what they had encountered during their previous hearing aid fitting experience
Hearing aid programming. Participants within each group who received the Quick-fit protocol had the experimental hearing aids programmed with the manufacturer’s fitting software to predicted NAL-NL2 target gain for experienced listeners, based only on audiometric thresholds. On the other hand, participants within each group who received the REM protocol were provided clinical services where the investigator measured the listener’s real-ear-to-coupler difference (RECD) bilaterally, using the methodology described in the Audioscan Verifit2 manual. The RECD and audiometric threshold data, was subsequently entered into the manufacturer’s software for the REM group resulting in an individualized NAL-NL2 prescriptive target, also designated for experienced listeners. This individualized target was then saved to the experimental hearing aids.
Hearing aid fitting. For participants who received the Quick-fit protocol, programming adjustments to the hearing aid were made based on anecdotal responses provided by the listener. Programming adjustments ceased when the patient verbally indicated that the devices provided him/her with comfort and clarity ratings of 8 on a 10-point scale (ie, 1 = lowest, 10 = highest) while listening to passages of the Connected Speech Test (CST).16 The CST passages were presented from a personal computer (PC) connected to a loudspeaker positioned directly in front of the listener at a distance of 1 meter at a presentation level of 68 dB SPL. No REMs were made for this subgroup during this portion of the study. The participant was then asked to complete both surveys and provide responses based on the clinical services received. The surveys were counterbalanced across participants, and provided by and returned to a secondary investigator who had not provided the professional services to reduce bias.
Participants experiencing the REM protocol had testing conducted following manufacturer’s guidelines. Each participant was informed of the purpose of the procedure and what was to occur, otoscopy was conducted, and the probe module was attached to the outer ear. The probe-tube was positioned within 5 mm of the eardrum using the visually assisted positioning technique. Participants were positioned directly in front of the REM loudspeaker (0° azimuth), facing the measurement screen at a distance of 0.5-1.0 m. The hearing aids were placed in the ear and programming adjustments to the hearing aid were made until the real-ear aided response (REAR) was within ±3 dB of the generated NAL-NL2 targets on the Verifit2 across frequencies for each input level. Participants were counseled regarding the meaning of the various measurement curves and symbols on the Speechmap® screen. As with the Quick-fit protocol group, anecdotal responses were also obtained, where each participant verbally rated the comfort and clarity of devices programmed to NAL-NL2 targets on a 10-point scale (ie, 1 = lowest, 10 = highest) while listening to CST passages. The CST passages were presented at the same distance, azimuth, and presentation level as described in the Quick-fit protocol. Slight adjustments (within ±5 dB) were made relative to the NAL-NL2 targets in 17 of the 30 (i.e., 57%) to obtain comfort/clarity ratings of 8/10 for participants in this study.
After the hearing aids were adjusted, final REARs were obtained for Verifit2 generated speech signals (standard Male) at input levels of 55- (soft speech), 65- (average speech), 75- (loud speech) dB SPL and MPO. The participant was then asked to complete both surveys, providing responses based on the clinical services received. The surveys were counterbalanced across participants, and provided by and returned to a secondary investigator—not associated with providing professional services—to reduce bias.
Post-fitting. At the conclusion of the study, participants who received the Quick-fit protocol were re-tested, this time receiving the same REM protocol provided to their within-group counterparts. Each participant also completed both surveys, using the same protocol that their counterparts received.
Results and Discussion
Willingness-to-pay. A multivariate analysis of variance (MANOVA) was performed to determine whether the independent variables of protocol (ie, Quick-fit, REM) and professional experience (ie, previous user, new user) had an effect on participants’ WTP. Recall that a price anchor of $250 was provided to all participants.
For the Experienced and In-the-Drawer groups, results revealed that listeners were willing-to-pay a maximum of $95.00 (95% confidence interval [CI95] ±$25.85) and $80.00 (CI95 ±$27.26), respectively, for their previous hearing aid fitting experience. As shown in Figure 3, these findings are not statistically different (p > .05) and fall significantly (p < .05) below the $250 anchor, suggesting that the average Experienced and In-the-Drawer participant perceived that they received similar, yet unacceptable professional services prior to participating in this study.
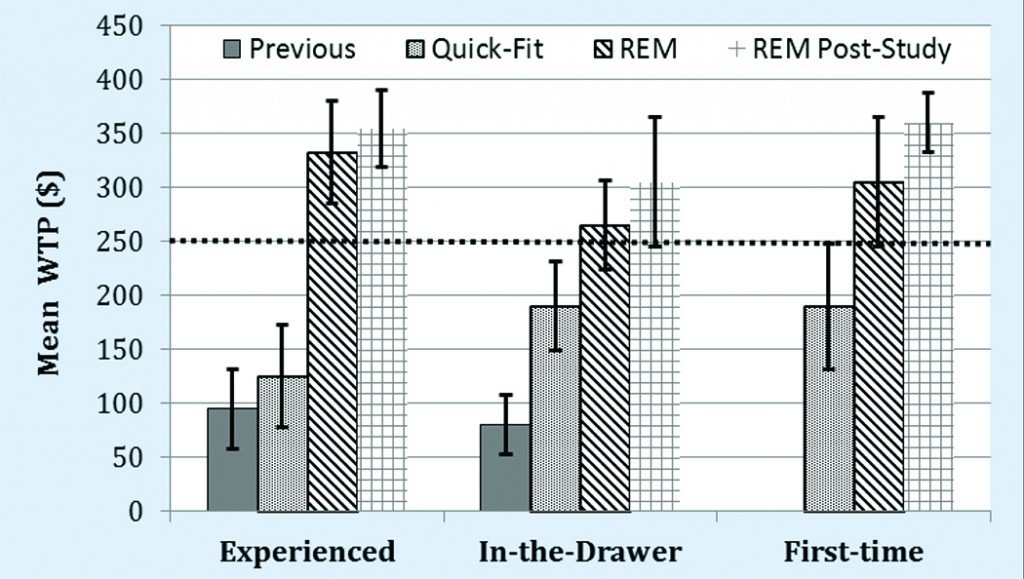
Figure 3. Mean willingness-to-pay by group for professional services received for 1) previous to participation in this study; 2) the Quick-fit (ie, First-fit) protocol; 3) the REM protocol, and 4) REM protocol received post Quick-fit protocol. The dashed line represents a price anchor for professional services established at $250.
When participants were dichotomized into receiving either the Quick-fit or REM protocol, results for the Experienced group revealed a WTP of $125 (CI95 ±$47.32) for the Quick-fit protocol and $332.50 (CI95 ±$47.32) for the REM protocol, shown in Figure 3. The difference in WTP between protocols was statistically significant (F2,17 = 20.04, p < .001). A post-hoc analysis revealed that only the REM protocol was statistically improved (p < .05) compared to the average participant’s perception of the previous professional services they received, by a margin of $237.50 ($332.50 – $95.00).
For the 10 participants in the Experienced group who received the Quick-fit protocol initially, we re-tested them using the REM protocol in the latter portion of the test session. Figure 3 indicates that participants who initially experienced the Quick-fit and then experienced the REM protocol provided a statistically significant (t(9) = 11.50, p < .001) increase in WTP. Here, mean responses appreciated by $230.00 compared to the Quick-fit procedure (ie, $355.00 – $125.00). No difference (p > .05) in mean WTP was noted between participants who initially received REM and participants who received REM after the Quick-fit protocol. Together, these findings support the notion that the lack of a standardized clinical protocol that employs REMs could be one reason why experienced users only return to their previous provider around 50% of the time.19
WTP results for the in-the-Drawer group, displayed in Figure 3, revealed a mean response of $190.00 (CI95 ±$41.21) and $265.00 (CI95 ±$41.21) for the Quick-fit and REM protocols, respectively. The difference in WTP between protocols was statistically significant (F2,17 = 4.16, p < .005), and both the Quick-fit and REM protocols were statistically improved (p < .05) compared to the average participant’s perception of the professional services they received prior to entering the study (Table 1). Figure 3 also displays the WTP initially provided by In-the-Drawer group participants who received the Quick-fit protocol and then later experienced the REM protocol. Results were statistically significant (t(9) = 4.64, p = .001). Here, mean responses improved by $115 compared to the previously experienced Quick-fit procedure ($305 – $190). No difference (p > .05) in mean WTP was noted between participants who initially received REM and participants who received REM after the Quick-fit protocol. While our study is confounded by an order effect (ie, Quick-fit always precedes REM protocol), the findings revealed that the average Experienced and In-the-drawer group participant found the REM protocol provided greater perceived value than the Quick-fit protocol.
Participants in the First-time group provided responses solely regarding the experimental session, as this group had no previous experience with hearing aids. Results yielded a statistically significant difference (F1,18 = 20.16, p < .001) in WTP, where the Quick-fit protocol yielded a mean of $195 (CI95 ±$46.32) and the REM protocol yielded a mean of $335 (CI95 ±$46.32), as shown in Figure 3.
Figure 3 further displays the difference in mean WTP for those First-time group participants who initially received the Quick-fit protocol and then later experienced the REM protocol. Mean WTP responses for the REM protocol significantly improved (t(9) = 4.61, p < .001) by $165 compared to the Quick-fit procedure (ie, $360 – $195). No difference (p > .05) in mean WTP was noted between First-time group participants who received only REM and participants who received REM after the Quick-fit protocol.
Lastly, the difference in mean WTP between protocols pooled across groups revealed that listeners—both experienced and inexperienced hearing aid users—observed differences in perceived value between the types of verification services provided by the practitioner. Verification services that are comprehensive enhance:
- The average participant’s psychology towards the amplification process, as determined in this study;
- Their self-perceived benefit towards the device,17 and
- Satisfaction towards the practitioner.18
Authors’ Note: The impact of the Quick-fit vs REM protocols on audibility will be discussed in a future article.
SERVAL
Emotional value. The dimension of emotional value quantifies a consumer’s experiences with a product or service relative to feelings of happiness, success, and confidence.19 Research indicates that emotional value is a primary indicator in assessing the acceptance and adoption of amplification in listeners with hearing difficulties.13,20 To assess the emotional value of providing verification services, we performed a nonparametric one-way analysis of variance. Overall results, depicted in Figure 4, revealed a significant improvement (ie, closer to a mean response of 1) in emotional value for the REM protocol compared to the Quick-fit protocol for the Experienced (Krusal-Wallis test; χ2(1) = 13.10, p < .001), In-the-Drawer (Krusal-Wallis test; χ2(1) = 11.50, p < .01), and First-Time (Krusal-Wallis test; χ2(1) = 14.75, p < .001) groups.
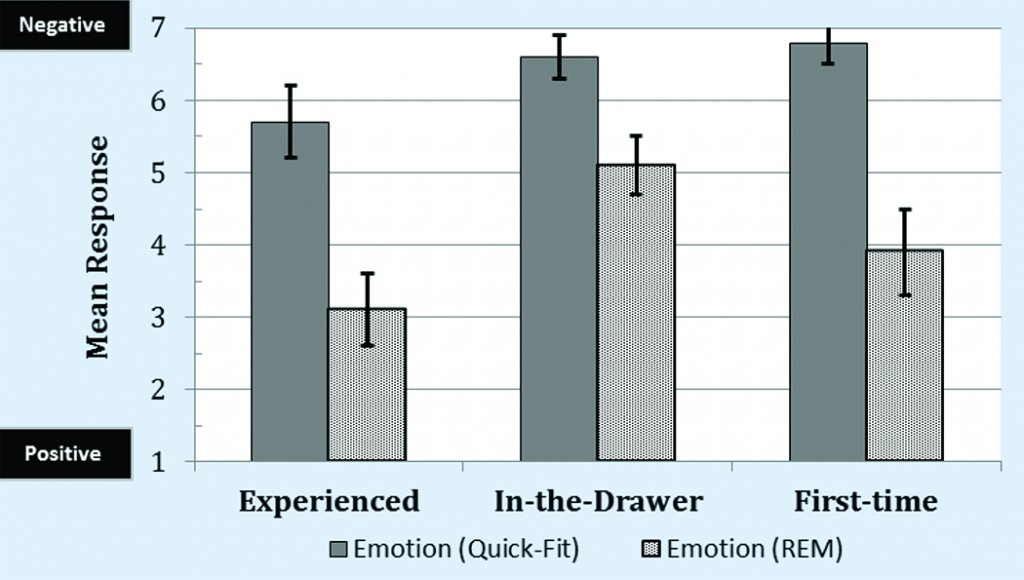
Figure 4. Mean responses by group for the SERVAL dimension of Emotion.
A post-hoc analysis of emotional value, which is characterized by the factors of satisfaction, anxiety, and affirmation, is shown in Figure 5. For satisfaction, findings indicated that participants in the Experienced group who were provided with the Quick-fit protocol were moderately satisfied (mean = 4.1 [CI95 ±0.5]) with the professional services they received. The mean response for those Experienced group participants who experienced the REM protocol was more positive, with a mean rating of 2.2 (CI95 ±0.2). This difference between protocols yielded a significant effect (Krusal-Wallis test; χ2(1) = 8.33, p < .05).
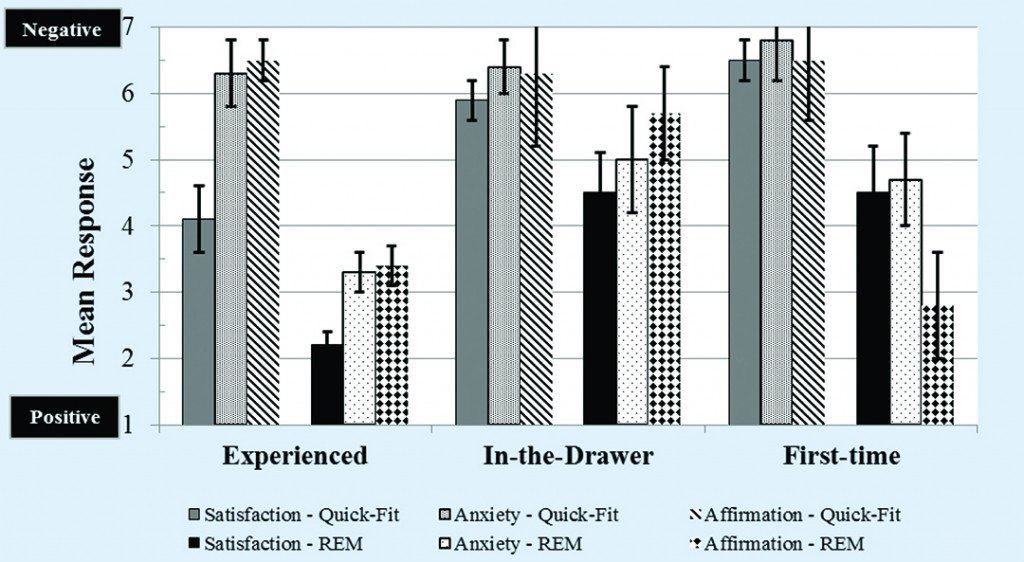
Figure 5. Post-hoc mean responses for the SERVAL dimension of Emotion by group towards services received for verification of amplification.
Participants of the In-the-Drawer and First-time groups who experienced the Quick-fit protocol rated satisfaction with professional service negatively with mean responses of 5.9 (CI95 ±0.7) and 6.5 (CI95 ±0.8), respectively. Satisfaction improved in both groups for those participants who experienced the REM protocol, as seen in Figure 5, by a mean rating of 1.4 and 2.0, respectively. This improvement in satisfaction between protocols was statistically significant for the In-the-Drawer (Krusal-Wallis test; χ2(1) = 12.84, p < .001) and First-time (Krusal-Wallis test; χ2(1) = 14.54, p < .001) groups. Together, these findings suggest that satisfaction with professional services decreases when practitioners employ a Quick-fit protocol, and increases when a REM protocol is provided. To the extent that patient satisfaction is associated with provider loyalty,21 these results suggest that the use of the Quick-fit protocol may be a contributing factor to the lack of loyalty seen by patients in this market.
For the emotional component of anxiety, mean response for the Quick-fit protocol across all three groups were similar and negative (ie, closer to a value of 7). This finding is consistent with past findings for participants in the First-time group,13 and expected for the In-the-Drawer group. However, we were not expecting a mean response of 6.3 (CI95 ±0.6) provided by participants in the Experienced group. An examination of individual data revealed that 8 out of 10 participants reported a value of 6 or 7 as it relates to anxiety. A post-hoc telephone interview with 6 of the 8 respondents revealed that Experienced group participants were concerned that Quick-fit adjustments to their devices would decrease speech intelligibility (n = 4), decrease sound quality (n = 2), or make listening levels uncomfortable (n = 2).
For the REM protocol, mean responses related to anxiety improved significantly (p < .05) over the Quick-fit protocol for all three groups, as shown in Figure 5. The smallest difference in mean responses was found for the In-the-Drawer group, where the REM protocol improved anxiety by an average of 1.4 (CI95 ±0.8).
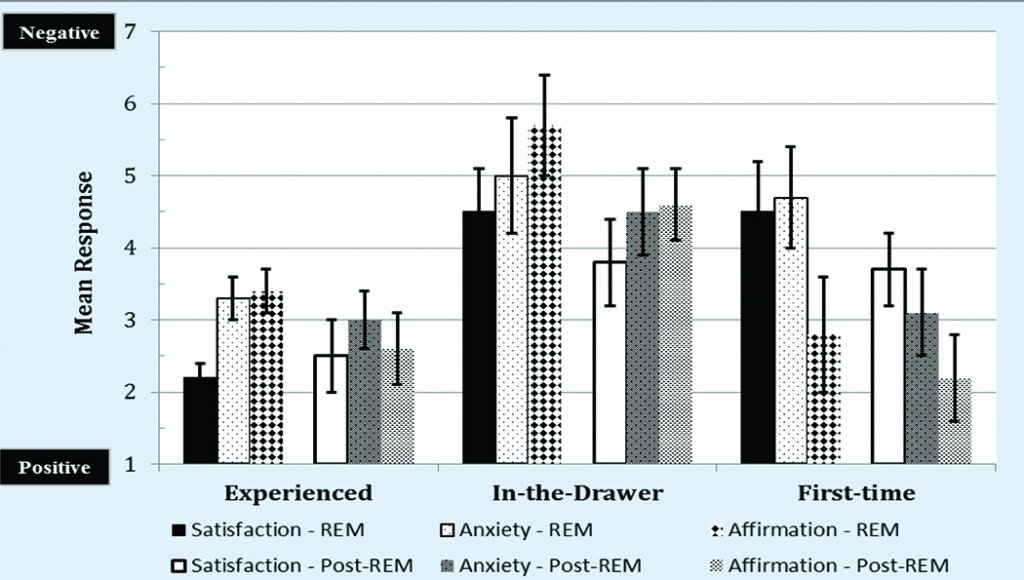
Figure 6. Post-hoc mean responses by group for the SERVAL dimension of Emotion towards services received by participants who experienced the REM protocol as part of their protocol and those participants who experienced the Quick-fit protocol initially and later received the REM protocol.
Affirmation, or the emotional reinforcement provided, was the third factor of emotional value quantified. Results from the Quick-fit protocol yielded mean responses of 6.5 (CI95 ±0.3), 6.3 (CI95 ±1.1), and 6.5 (CI95 ±0.9) for the Experienced, In-the-Drawer, and First-time groups, respectively. As seen in Figure 5, affirmation was significantly (p < .05) more positive (ie, mean responses closer to 1) for participants who experienced the REM protocol compared to the Quick-fit protocol, with mean differences in responses of 3.1 (CI95 ±0.3) and 3.7 (CI95 ±0.8) for the Experienced and First-time groups, respectively. Only a slight, non-significant mean improvement of 0.6 (CI95 ±0.7) was reported by participants in the In-the-Drawer group who experienced the REM protocol. This finding, combined with the findings from the anxiety component, suggests that In-the-Drawer listeners could benefit from additional counseling to reduce their anxiety levels and positively reinforce the perception of amplification before attempting a second trial period.
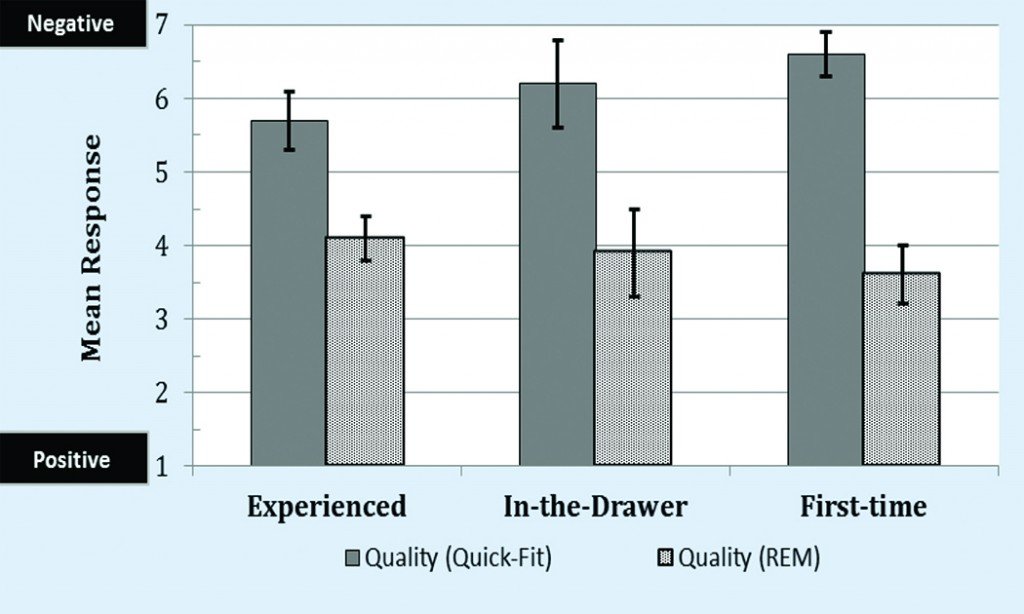
Figure 7. Mean responses by group for the SERVAL dimension of Quality.
Lastly, participants in all three groups who initially experienced the Quick-fit protocol were subjected to the REM protocol during a second-test phase. As shown in Figure 6, results revealed that mean responses obtained with participants who received the REM protocol during the second-test phase did not differ significantly (p > .05) from participants who were provided with the REM protocol initially. We infer that the findings from this expected outcome indicates that satisfaction of users and potential users of hearing aids is not necessarily linked to the clinician as much as it is linked to the type of professional services provided.
Quality value. Quality assesses the consumer’s judgements about the overall excellence of the service provided, and how that service might influence the perception of a product.22 Results are displayed in Figures 7-9.
Figure 7 depicts the overall results, which revealed a significant effect for the REM procedure over the Quick-fit procedure for Experienced (Krusal-Wallis test; χ2(1) = 13.11, p < .001), In-the-Drawer (Krusal-Wallis test; χ2(1) = 11.50, p < .01), and First-time (Krusal-Wallis test; χ2(1) = 13.75, p < .001) groups.
Two service factors were assessed in this quality dimension, with an additional question related to the hearing aid itself. The two service factors queried were: 1) Outstanding service, and 2) Exceeded expectation. For the former, the Quick-fit protocol failed to yield a mean positive rating for “outstanding service,” with responses between 6.5 and 6.8 ranging across groups (Figure 8). Participants who experienced the REM protocol rated “outstanding service” moderately—between 3.5 (ie, First-time group) and 4.8 (ie, In-the-Drawer group)—with improvements in mean responses ranging between 2.4 and 3.3. The improvement in mean ratings on this metric was significant (p < .05) for all three groups. For the latter dimension of “exceeded expectation,” the In-the-Drawer group reported a more positive (ie, closer to a value of 1) mean response for the Quick-fit protocol (4.9, CI95 ±1.0), followed by the Experienced (5.5, CI95 ±0.7), and First-time groups (6.5, CI95 ±0.8). Based on this finding, we surmise that the Quick-fit protocol used in this study may have provided greater patient-provider involvement for Experienced and In-the-drawer users than they had received during their previous hearing aid fitting experience(s). Results from the REM protocol indicate a small insignificant (p > .05) improvement in “exceeded expectation” for the Experienced (4.7, CI95 ±0.6) and In-the-Drawer (3.9, CI95 ±0.8) groups, shown in Figure 8. While the analysis shows no significant effect, the mean improvement in rating of 1.0 by the In-the-Drawer group must not be overlooked from a clinical standpoint, and could be the difference between hearing aid use and a hearing aid return. The mean rating for the first-time group improved by 3.3 (CI95±0.7) with the REM protocol compared to the Quick-fit protocol, indicating that REM improved the perception of the provider in the eyes of the user. This improved perception is the basis for loyalty, which will be discussed in an upcoming article.
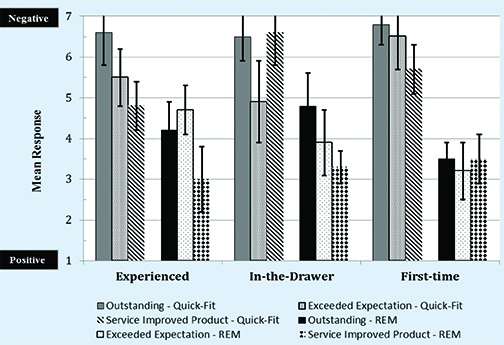
Figure 8. Post-hoc mean responses for the SERVAL dimension of Quality by group towards services received for verification of amplification.
One of the most important dimensions queried, was whether the verification improved the perception of the product. The aim was to quantify the consumer’s perception relative to how the provider’s services solve their problem (ie, inability to understand speech) and fulfill their needs (ie, restore audibility through an augmentative device). As shown in Figure 8, the findings show that the Quick-fit protocol yielded a mean response of 4.8 (CI95 ±0.6), 5.7 (CI95 ±0.6), and 6.6 (CI95 ±0.8) for the Experienced, First-time, and In-the-Drawer groups, respectively. The REM protocol improved the perception of the hearing aid to mean rankings of 3.0 (CI95 ±0.8), 3.5 (CI95 ±0.6), and 3.3 (CI95 ±0.4) for these same groups. Clearly, the provision of REMs—not Quick-fit—increased the users’ confidence that the hearing aid provided them with the opportunity to understand speech in their everyday environments.
Finally, a comparison between the Quick-fit and REM protocols for the cohort that received both protocols revealed no significant difference (p < .05) in mean responses obtained for the REM protocol during the second-test phase compared to the REM protocol responses obtained initially (Figure 9).
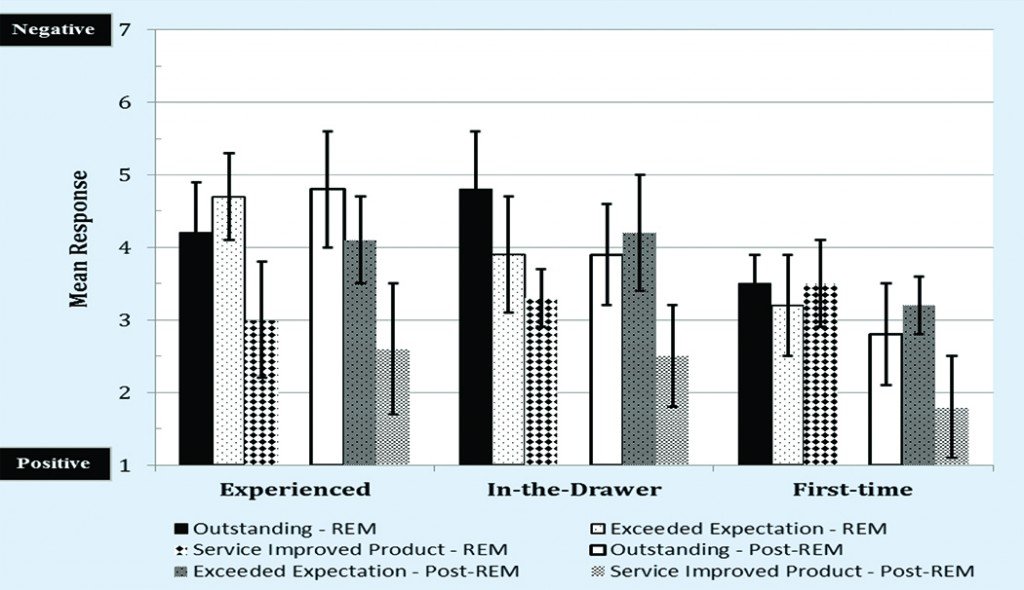
Figure 9. Post-hoc mean responses by group for the SERVAL dimension of Quality towards services received by participants who experienced the REM protocol as part of their protocol and those participants who experienced the Quick-fit protocol initially and later received the REM protocol.
Price value. The third dimension assessed in this study was the price value of the professional services received (Figures 10-12). Specifically, participants provided responses to the factors of: 1) “Worth the money,” and 2) “Good buy.”
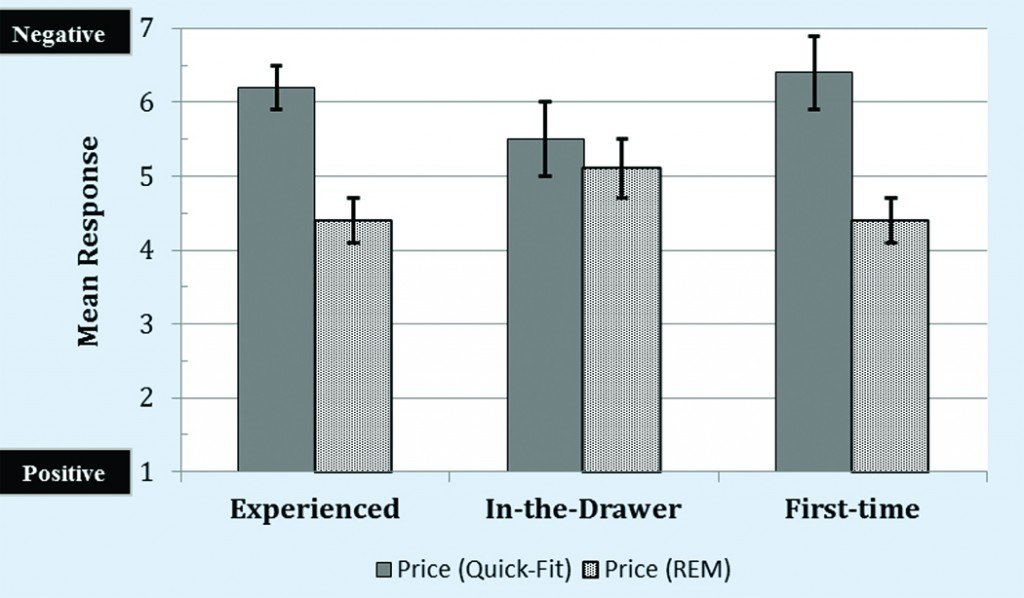
Figure 10. Mean responses by group for the SERVAL dimension of Price.
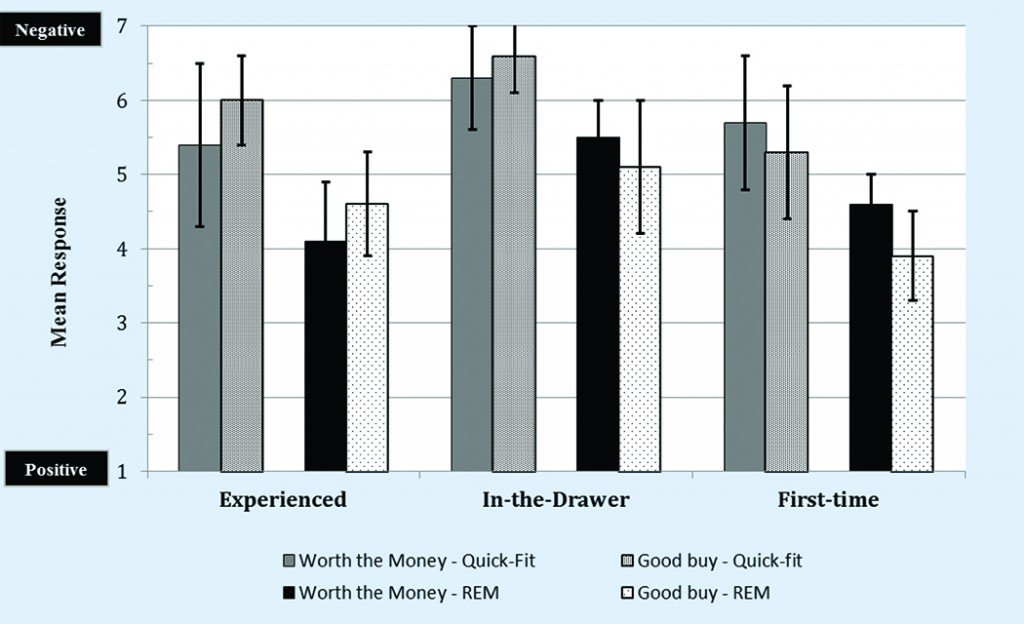
Figure 11. Post-hoc mean responses for the SERVAL dimension of Price by group towards services received for verification of amplification.
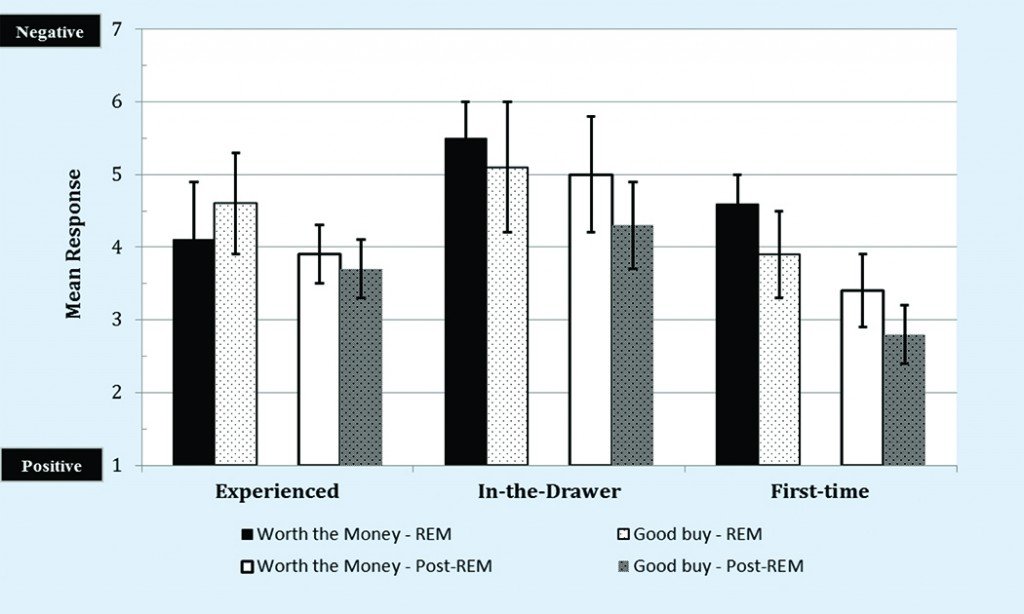
Figure 12. Post-hoc mean responses by group for the SERVAL dimension of Price towards services received by participants who experienced the REM protocol as part of their protocol and those participants who experienced the Quick-fit protocol initially and later received the REM protocol.
Overall results, displayed in Figure 10, yielded a significant improvement (ie, closer to a mean response of 1) in price for the REM protocol compared to the Quick-fit protocol for the Experienced (Krusal-Wallis test; χ2(1) = 14.56, p < .001) and First-Time (Krusal-Wallis test; χ2(1) = 13.71, p < .001) groups. Differences in protocols were not statistically significant (Krusal-Wallis test; χ2(1) = 1.90, p > .05) for the In-the-Drawer group.
The factor of “worth the money” is a measure of price value. Results across groups revealed significant (p < .05) improvements in mean rating of 1.3 (CI95 ±0.8), 0.8 (CI95 ±0.5), and 1.1 (CI95 ±0.4) for the Experienced, In-the-Drawer, and First-time groups, respectively, favoring the REM protocol (Figure 11). Conversely, no significant differences were found between protocols for the factor of “good buy” for any group. This positive finding suggests that all three groups perceived the REM procedure as a worthwhile expense in contrast to the Quick-fit protocol. Figure 12 highlights mean responses towards price comparing those participants who received the REM protocol initially and those who received the REM during the second-test phase. Results revealed no significant differences (p > .05) once each group received the REM protocol.
In summary, participants in all three groups perceived the pricing (financial) value of the REM protocol compared to the Quick-fit protocol. This finding bodes well for practices that are considering itemizing (unbundling) their services.
Perceived value. Perceived value reflects the consumer’s purchase intent towards a service or product, with intent increasing when the perception of what is received positively exceeds price. As shown in Figure 13, the overall mean perceived value of the Quick-fit protocol is negative (ie, closer to a value of 7) for all three groups.
This outcome, along with the WTP results presented earlier in this article, supports the position that service provision is a catalyst to the adoption of amplification. Results from the REM protocol, also shown in Figure 13, shows a significant (p < .05) improvement in perceived value for all three groups, which, in theory, may result in an increase in hearing aid adoption.
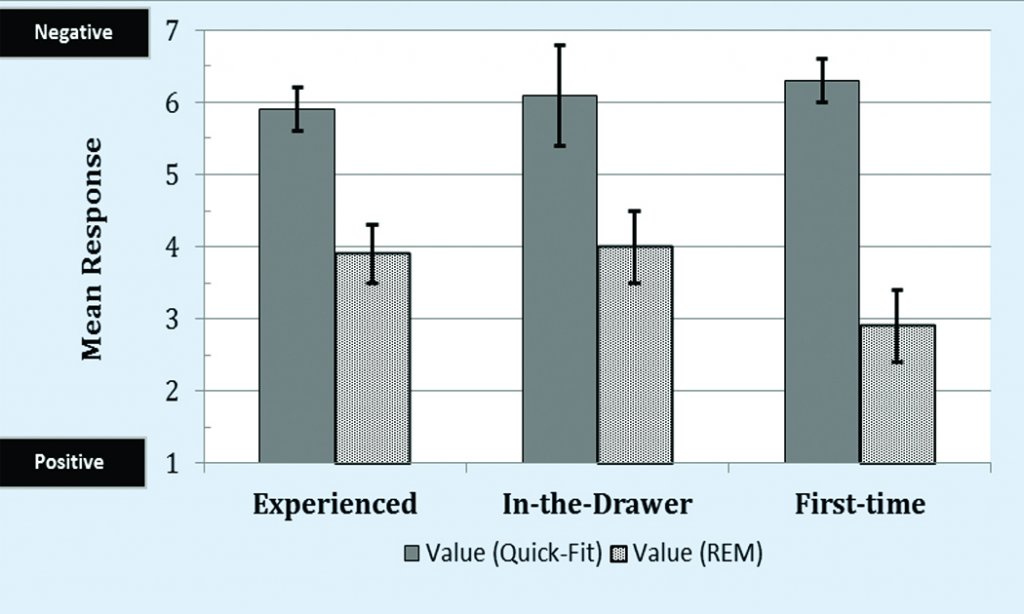
Figure 13. Mean responses by group for the SERVAL dimension of Perceived Value.
In this study, we assessed three factors related to perceived value: 1) Overall value, 2) Needs satisfied, and 3) WTP. In Figure 14, all three factors yielded a negative mean rating across all three groups for the Quick-fit protocol. A statistically significant (p < .05) improvement was found for all three factors across all three groups for those participants who experienced the REM protocol.
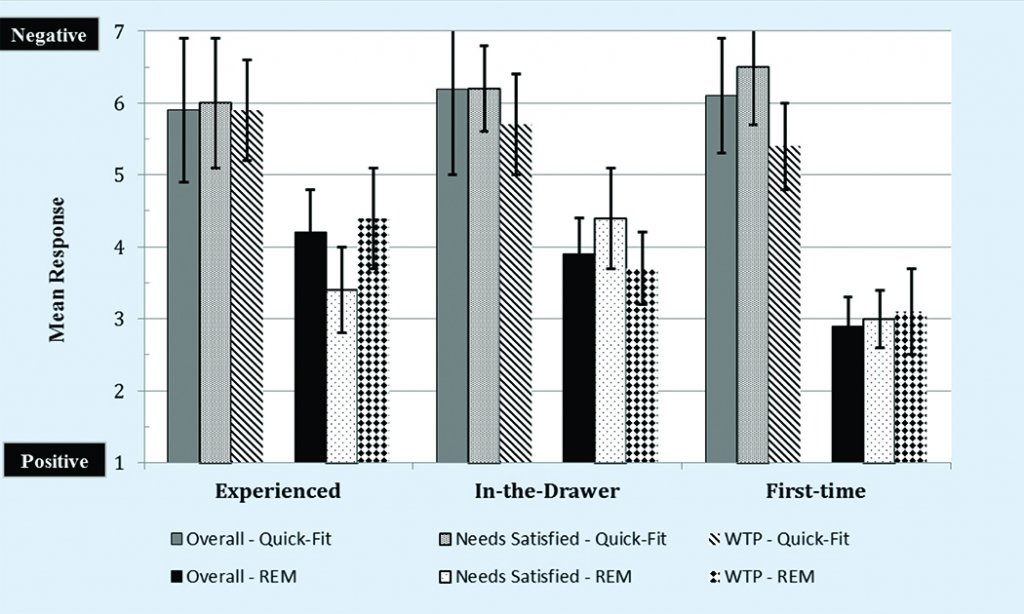
Figure 14. Post-hoc mean responses for the SERVAL dimension of Perceived Value by group towards services received for verification of amplification.
Lastly, no significant differences (p > .05) in mean responses were noted between participants across groups for those who experienced the REM protocol initially versus those who experienced the REM protocol after initially receiving the Quick-fit protocol (Figure 15).
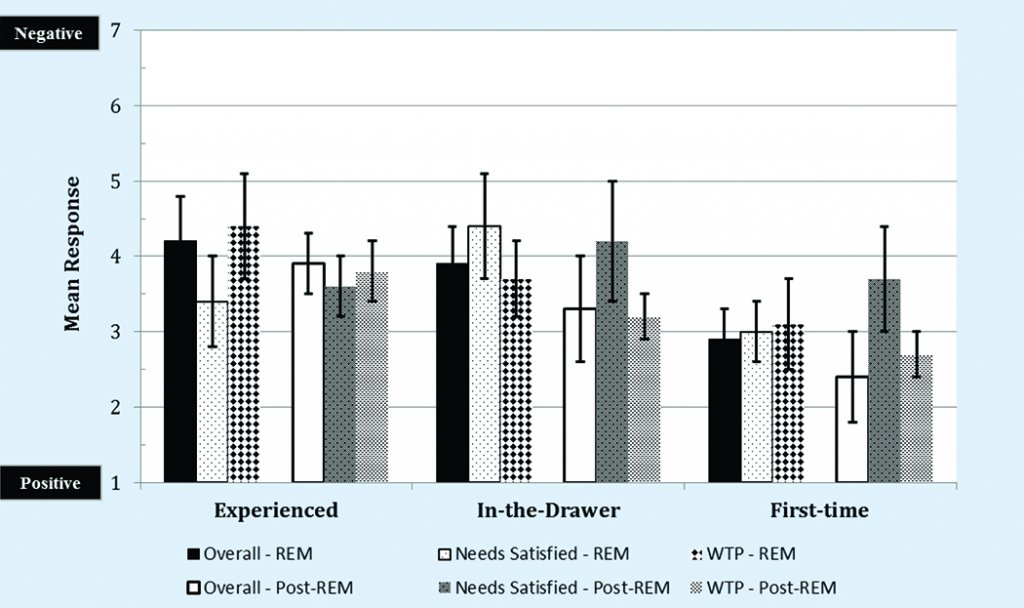
Figure 15. Post-hoc mean responses by group for the SERVAL dimension of Perceived Value towards services received by participants who experienced the REM protocol as part of their protocol and those participants who experienced the Quick-fit protocol initially and later received the REM protocol.
Behavioral intent. Behavioral intent measures a consumer’s re-purchase plans.22 For all three groups, the negative mean responses, shown in Figure 16, suggest that the Quick-fit protocol will yield poor re-purchase plans, thus compromising patient satisfaction and loyalty to the practice, practitioner, and, by association, to the hearing aid manufacturer.
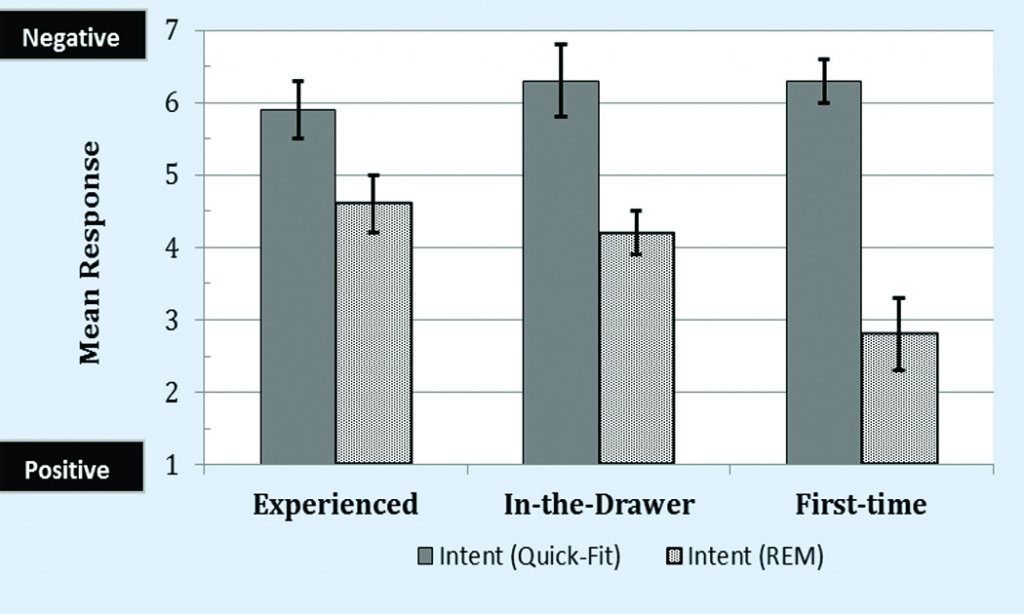
Figure 16. Mean responses by group for the SERVAL dimension of Behavioral Intent.
Providing REMs, conversely, resulted in significantly improved (p < .05), positive mean responses, especially for the First-time group. The findings from this study corroborate the need to standardize clinical procedures that incorporate REMs and validation measures, which, based on the literature, would increase the loyalty rate from roughly 57.4% to 84.3%.23
The factors of “positive comments,” “recommend services,” and “request service” were assessed with respect to behavioral intent. The factor of “positive comments” yielded moderate mean ratings for the Quick-fit protocol for all three groups (Figure 17). These ratings did not improve significantly (p > .05) when participants experienced the REM protocol. This finding might be related to the empirical manner in which we provided services, and possibly could be improved with a more flexible model of service provision.
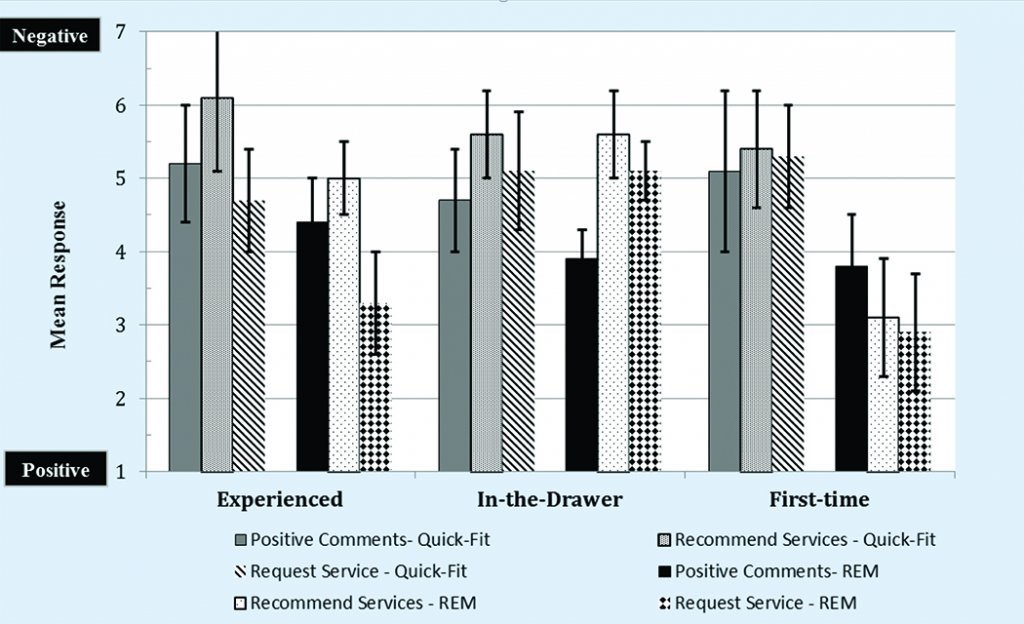
Figure 17. Post-hoc mean responses for the SERVAL dimension of Behavioral Intent by group towards services received for verification of amplification.
Participants in both the Experienced and In-the-Drawer groups ranked “recommend services” moderately for both protocol types, as shown in Figure 17. Only the First-time group’s mean rankings were noted as positive (ie, mean ranking of < 3), but not statistically differentiated (p > .05) by protocol. This latter finding appears to be related to the previous work of Amlani,13,24 who reported that First-time users of amplification are content, at least initially, with some interaction with the practitioner. What remains elusive is pinpointing those factors that sour this positive perception as the patient gains experience with amplification.
With respect to the final factor, “request service,” the results yielded significantly more positive (p < .05) mean responses for the REM protocol compared to the Quick-fit protocol, but only for the Experienced and First-time groups. Mean responses for the In-the-Drawer group yielded similar responses for both protocols. A rationale for this latter finding is unclear. Finally, no significant difference (p > .05) was found for those who received the REM protocol during the second-test phase after a Quick-fit experience compared to those who only received the REM protocol (Figure 18).
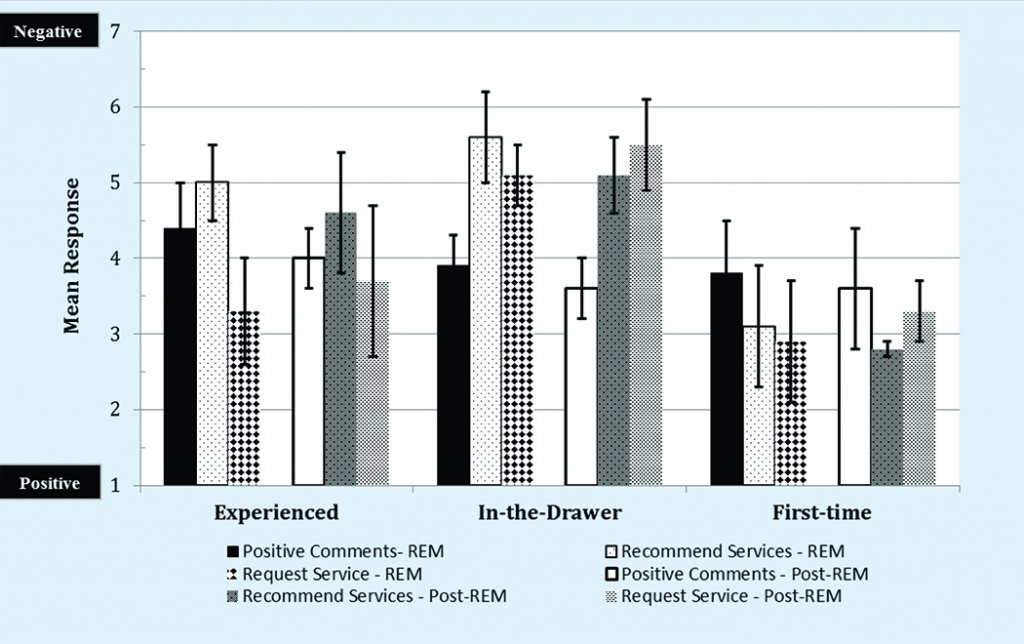 Figure 18. Post-hoc mean responses by group for the SERVAL dimension of Behavioral Intent towards services received by participants who experienced the REM protocol as part of their protocol and those participants who experienced the Quick-fit protocol initially and later received the REM protocol.
Clinical Implications
The primary purpose of this study was to assess the impact of REMs on consumer satisfaction as a service component during the hearing aid fitting process. For the SERVAL scale, overall results revealed that the REM protocol reduced emotional distress, and improved perceived quality of service and value of the hearing aid fitting experience compared to the Quick-fit protocol in all three groups of participants. Together, the improvement in these areas is expected to be correlated with increased behavioral intent, resulting in an increased positive perception of hearing aid provision services that include REM.
The findings of the SERVAL were validated by the results obtained from the WTP scale, which indicated an improved perception of the clinician when REM services were provided. For the participants in the Experienced and First-time groups, larger improvements were noted between the REM and Quick-fit protocols for SERVAL responses, while smaller improvements were observed for the In-the-drawer group. For participants in the First-time group, research has shown that decreasing emotional distress improves their perceived value of amplification.13,20
The SERVAL results revealed smaller differences between the REM and Quick-fit protocols for the In-the-Drawer group, suggesting that this group has greater resistance to the amplification process. This resistance, however, could be reduced through implementation of a REM protocol. While we did not test the influence of counseling in this study, we conjecture that the In-the-Drawer group might have yielded improved SERVAL responses had we utilized a different, more holistic counseling approach.
Overall, findings in this study suggest:
- Satisfaction of hearing aid users can be linked to the type of verification services offered;
- REM can enhance patient psychology of the amplification process, self-perceived benefit of their amplification device, satisfaction with the practitioner, and by association, patient loyalty;
- The lack of a standardized protocol that employs REMs may be one reason why patients do not return to their previous provider;
- The provision of REM can positively impact the user’s confidence with, and perception of, their hearing aid, and
- REM was deemed as a worthwhile expense—a finding that bodes well for clinicians who are considering itemizing (unbundling) and listing REM as a provided service.
The findings reported in this study also address, indirectly, aspects of the recent PCAST and NAS reports, namely the need to:
- Develop and promote best practices and measures to assess and improve quality of hearing health care services, and
- Empower consumers and patients in their use of hearing health care.
The REM protocol promotes an evidence-based assessment that allows the clinician to provide a more transparent hearing healthcare experience than the Quick-fit protocol used in this study. This increased transparency enlightens patients about the value of the services they are being provided, and also provides clinicians with the opportunity to itemize services. To the extent that participants in this study reported a willingness to pay more for a service experience that included REM (vs Quick-fit), the potential for increased revenue should also be considered by clinicians when deciding on which services to offer their patients. Clearly, the inclusion of REM in clinical practice improves the hearing healthcare experience for both patients and clinicians.
Acknowledgments
Audioscan provided funding for this study. Portions of this paper were presented at AudiologyNOW! in Phoenix, Arizona, April 13-16, 2016.
References
- Beck D. Hearing aids, real-ear measures, FM technology, and more: An interview with Michael Valente, PhD. Dec 18, 2008. Available at: http://www.audiology.org/news/hearing-aids-real-ear-measures-fm-technology-and-more-interview-michael-valente-phd
- Mueller HG, Picou EM. Survey examines popularity of real-ear probe-microphone measures. Hear Jour. 2010;63(5):27-32.
- Sanders J, Stoody T, Weber J, Mueller HG. Manufacturers’ NAL-NL2 Fittings Fail Real-ear Verification. Hearing Review. 2015;21(3):24.
- American Academy of Audiology. Guidelines for the Audiological Management of Adult Hearing Impairment. Audiology Today. 2006;18(5):32-37.
- American Speech-Language-Hearing Association. Guidelines for Hearing Aid Fitting for Adults. 2015. Available at: http://www.asha.org/PRPSpecificTopic.aspx?folderid=8589935381§ion=Key_Issues
- Mueller HG. Probe-mic measures: Hearing aid fitting’s most neglected element. Hear Jour. 2005;57(10): 33-41.
- Aazh H, Moore BC, Prasher D. The accuracy of matching target insertion gains with open-fit hearing aids. Am J Audiol. 2012;21(2):175-180. doi: http://dx.doi.org/10.1044/1059-0889(2012/11-0008)
- Mueller HG. 20Q: Real-ear probe-microphone measures—30 years of progress? January 13, 2014. Available at: http://www.audiologyonline.com/articles/20q-probe-mic-measures-12410
- President’s Council of Advisors on Science and Technology. Oct 23, 2015. Available at: http://www.hearingreview.com/2015/10/pcast-report-hearing-loss-raises-concerns
- National Academy of Sciences, Engineering, and Medicine. June 2, 2016. Available at: http://www8.nationalacademies.org/onpinews/newsitem.aspx?RecordID=23446
- Folstein MF, Folstein SE, McHugh PR. Mini-mental state. A practical method for grading the cognitive state of patients for the clinician. J Psych Res. 1975; 12(3): 189–98.
- Keidser G, Dillon, H, Flax, T, Ching T, Brewer S. The NAL-NL2 prescription procedure. Audiology Research. 2011;10(1):e24. Available at: http://doi.org/10.4081/audiores.2011.e24
- Amlani AM. Influence of perceived value on hearing aid adoption and re-adoption intent. Hearing Review Products. 2013;20(3):8-12.
- Petrick J. Development of a multi-dimensional scale for measuring the perceived value of a service. Journal of Leisure Research. 2002;34:119-134.
- Smriga D. Speechmap as a counseling and fitting tool. May 26, 2015. Available at: http://www.audiologyonline.com/articles/speechmap-as-counseling-and-fitting-14232
- Cox RM, Alexander GC, Gilmore C. Development of the Connected Speech Test (CST). Ear Hear. 1987;8 [Suppl 5]:119S-126S.
- Kochkin S, Beck DL, Christensen LA, Compton-Conley C, Kricos PB, Fligor BJ, McSpaden JB, Mueller HG, Nilsson MJ, Northern JL, Powers TA, Sweetow RW, Taylor B, Turner RG. MarkeTrak VIII: The impact of the hearing healthcare professional on hearing aid user success. Hearing Review. 2010;17(4):12-34.
- Abrams HB, Chisolm TH, McManus M, McArdle R. Initial-fit approach versus verified prescription: Comparing self-perceived hearing aid benefit. J Am Acad Audiol. 2012;23(10):768-778.
- Petrick J. First timers and repeaters perceived value. Journal of Travel Research. 2004;43:29-38.
- Cobelli N, Gill L, Cassia F, Ugolini M. Factors that influence intent to adopt a hearing aid among older people in Italy. Health Society Care Community. 2014;22(6):612-622.
- Du Plessis L. Customer relationship management and its influence on customer loyalty at Liberty Life in South Africa. University of Johannesburg;2010.
- Tam J. Customer satisfaction, service quality and perceived value. J Marketing Management. 2004;20:897-978.
- Kochkin S. A comparison of consumer satisfaction, subjective benefit, and quality of life changes associated with traditional and direct-mail hearing aid use. Hearing Review. 2014;21(1):16-26.
- Amlani AM. Application of the consumer decision-making model in assessing hearing aid adoption intent in first-time users. Seminars in Hearing. 2016; 37(2):103-119.