Predicting Speech Perception from the Audiogram and Vice Versa
The goal of this research was to investigate a new method of converting between audiograms and speech perception measures to demonstrate their equivalence or otherwise. Our scientific reason for attempting this study was to increase the understanding of the connection between speech perception performance and hearing loss, and our practical reason was to provide improved hearing aid fittings for people without the need for a hearing test conducted with an audiometer in a sound booth.
The prediction of speech perception scores from the audiogram has been studied in the past with mathematical methods such as the articulation index1,2 and the speech intelligibility index.3 The effect of hearing loss on speech perception is also often explained graphically by showing speech sounds as symbols on the audiogram,4 by using a Speechmap derived from a real ear measurement,5 or by superimposing a representation of the intensity and frequency distributions of speech on equal loudness curves as in Figure 1.

Figure 1. Equal loudness curves at 20, 40, 70, and 90 Phons are superimposed on the frequency/intensity distribution of conversational speech. As hearing loss increases, speech information is lost progressively, starting with the softer higher frequency sounds. Even a mild hearing loss of 20–40 dB HL can have a significant effect on speech perception.
The prediction of an audiogram from a speech perception test is much more difficult. It is mathematically impossible to predict an audiogram from a single speech perception score because there is no frequency-specific information in a single score. Instead, one needs to know about the pattern of phonetic confusions that contribute to the speech perception score and extract frequency-specific information from the pattern. The Infogram™ described here is an attempt to do just that, and to display the speech information in a way that is intuitive for lay people to understand. The Infogram is loosely based on the research of Miller and Nicely6 who found relationships between the information transmitted for a set of consonant features in people with normal hearing and the cut-off frequencies of low- and high-pass filters.
The Infogram™
The Infogram™ is derived from the Speech Perception Test (SPT) found at www.blameysaunders.com.au. The SPT is a monosyllabic word test with the following characteristics:
- Fifty consonant-vowel-consonant words per list
- Designed to be used in any reasonably quiet environment
- Presented at a “comfortable level” of about 65 dBA
- Recorded by a female speaker of Australian English
- Thirty two phonetically balanced lists
- Random list selection and random word order within lists
- Automatic analysis and reporting of word, consonant, and vowel scores
The SPT was validated in an initial study of 39 people with known “good hearing” who did not use hearing aids and 49 hearing aid users in the unaided condition.7 The distribution of SPT scores in the validation study showed 94% sensitivity and 98% specificity for hearing loss compared with 80% and 83% for the commonly used telephone digit screening test8.
A consonant confusion matrix and a vowel confusion matrix are constructed from the words presented and the listener’s responses. The matrices are then subjected to information transmission analysis for a set of ten phonetic features and the percentage of information transmitted is displayed for each phonetic feature. This graph is called the Infogram (Figure 2).

Figure 2. A typical Infogram showing the percentage of information transmitted for ten speech features ordered from those conveyed by low frequencies on the left to those conveyed by high frequencies on the right.
The consonant features are nasality, manner of production, voicing, affrication, sibilance, and place of articulation. The vowel features are vowel height, second formant contour (rising / falling / flat), vowel place, and vowel length. The shape of the Infogram is often similar to the shape of the conventional audiogram. Good hearing is at the top (100% information transmission corresponds to zero hearing loss) and poor hearing is towards the bottom of the Infogram (low information transmission corresponds to profound hearing loss).
Data Collection and Analysis:
Two thousand five hundred and thirty-four de-identified audiograms were collected from online and clinic customers of Blamey & Saunders Hearing Pty Ltd. The clinic audiograms were collected using standard audiometric equipment and procedures (Otovation Symphony or Medrex). Audiograms for online clients were provided in graphical form and entered into the database by hand. Principal components analysis (PCA) was used to extract shape information from the audiograms.
A total of 6068 de-identified SPT results were collected clinically or online and Infograms were calculated. The clinical testing was performed at 65 dBA and the online testing was performed at a comfortable level under relatively uncontrolled conditions. Principal components analysis was used to extract shape information from the Infograms.
There were 418 clients for whom both audiogram and Infogram were available within the two data sets. The SPT was performed binaurally in a free field at a comfortable level, so it was assumed that the results would reflect the hearing in the better ear, or the best audiogram. The better of the left and right ear thresholds was chosen at each frequency to determine the best audiogram. Multiple linear regression was used to generate matrices relating the best audiogram principal components to the Infogram principal components and vice versa. These matrices were combined with the principal component calculation matrices to produce estimates of the audiogram from the Infogram and vice versa.
Results
The first principal component of the audiogram, PC1a, was highly correlated with the Pure Tone Average hearing loss (r = 0.938, p < 0.001). PC2a and PC3a gave measures of slope and convexity of the best audiogram respectively.
The first four principal components accounted for 95% of the variability in the sample of 6068 Infograms (Figure 3). As for the audiogram, the first component, PC1i, was highly correlated with PTA (r = −0.643, p < 0.001). The other principal components were related to more complex components of the Infograms.

Figure 3. The first four principal components accounted for 95% of the variability in a sample of 2534 audiograms.
The multiple regression analyses of the audiogram principal components using the Infogram principal components as independent variables accounted for 41.4% of the variance in PC1a; 41.4% in PC2a; 18.2% in PC3a; 17.9% in PC4a; and less than 10% of the variance of the remaining audiogram principal components. The first four multiple regressions were highly statistically significant (p < 0.001).
The multiple regression analyses of the Infogram principal components using the audiogram principal components as independent variables accounted for 44.0% of the variance in PC1i; 8.2% in PC2i; 12.9% in PC3i; 8.3% in PC5i; 8.6% in PC10i; and less than 5% of the variance of the other Infogram principal components. The multiple regressions for PC1i, PC2i, PC3i, PC5i and PC10i were highly statistically significant (p < 0.001).
As illustrated in Figure 4, the mathematical equations derived from the multiple regressions and the principal components analyses can be combined to estimate the best audiogram from a binaural SPT and Infogram, or to predict the Infogram from the best ear audiogram. The statistical results imply that the predicted hearing thresholds in the better ear, based on the information transmission results from a single SPT in the binaural condition are highly correlated with the actual hearing thresholds measured with an audiometer at every frequency (p < 0.001).
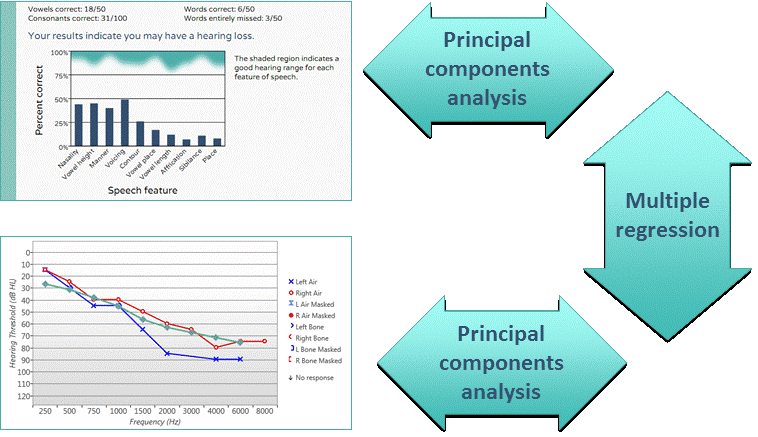
Figure 4. The Infogram can be used to estimate the audiogram and vice versa.
Figure 4 shows an example where the audiogram was estimated from the Infogram shown in Figure 2. The “speech audiogram,” shown in green, was very close to the right (better ear) audiogram but slightly overestimated the low and mid-frequency losses. Although the “speech audiograms” followed the same general shape as the conventional audiograms, in general they tended to be smoother and have shallower slope because of the broadband nature of the speech features used in the Infogram.
Figure 5 illustrates the correspondence between hypothetical flat audiograms for normal hearing, mild, moderate, severe and profound hearing losses, and corner and ski-slope audiograms shown in Figure 5a, and the calculated Infograms shown in Figure 5b.
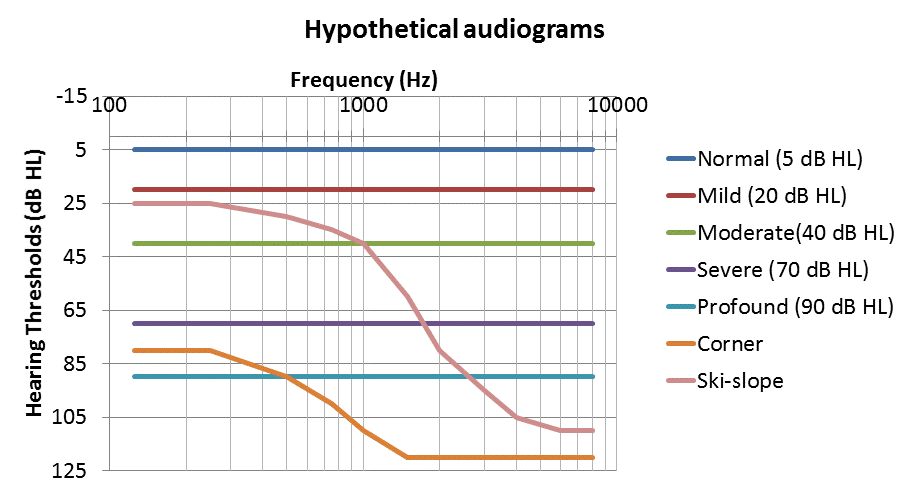
Figure 5a. Hypothetical audiograms to illustrate the correspondence between audiograms and Infograms.
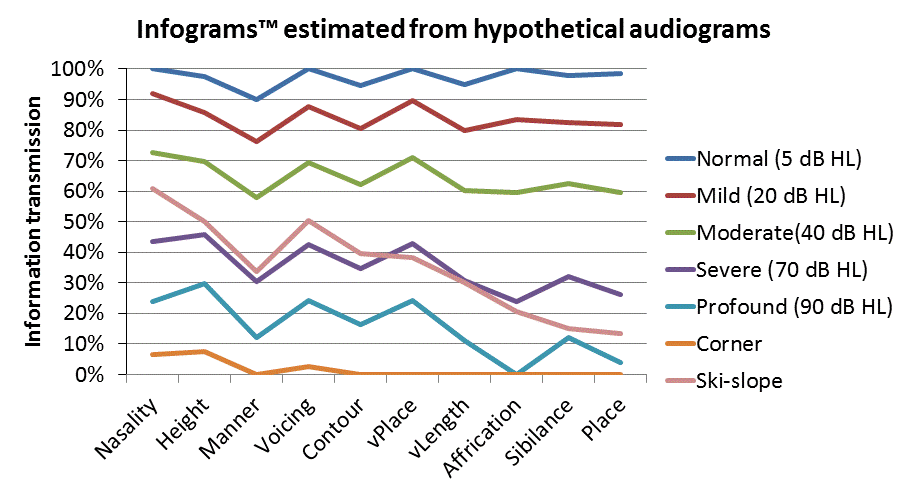
Figure 5b. Infograms calculated from the hypothetical audiograms shown in Figure 5a.
Infograms calculated from flat hearing losses tended to slope downwards from left to right as expected from the higher intensity of speech at low frequencies compared to high frequencies. This implies that a flat hearing loss will have a greater effect on high frequency speech features as suggested by Figure 1. The ski-slope audiogram corresponded to a more steeply sloping Infogram and the corner audiogram predicted very poor speech discrimination, limited to the nasality, vowel height, and voicing features. Hypothetical Infograms and the corresponding “speech audiograms” are shown in Figures 6a and 6b.
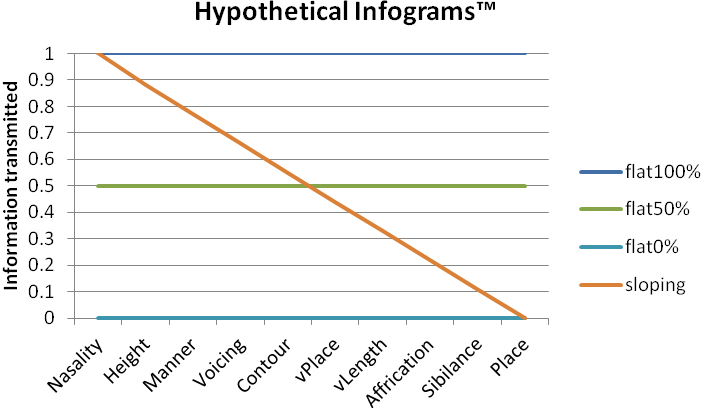
Figure 6a. Hypothetical Infograms to illustrate the correspondence between Infograms and audiograms.
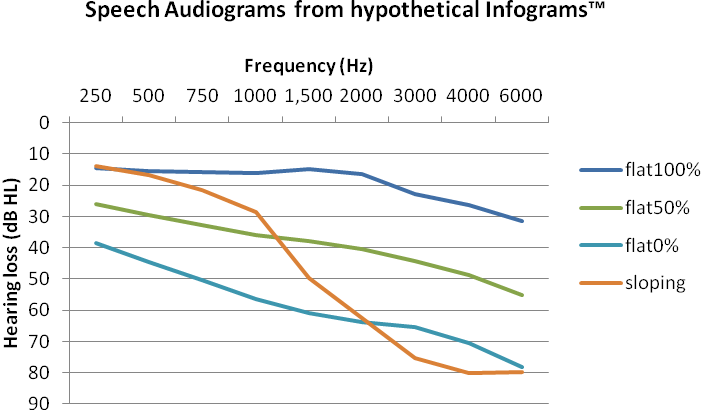
Figure 6b. “Speech audiograms” corresponding to the hypothetical Infograms in Figure 6a.
The audiograms predicted from flat Infograms tended to slope downwards from left to right while the sloping Infogram predicted a ski-slope audiogram. Lower percentages of information transmitted in the Infograms predicted greater degrees of hearing loss as expected. A 50% drop in information transmitted corresponded to about a 25 dB increase in hearing loss in the mid to high frequencies and about 15 to 20 dB increase in hearing loss in the low frequencies.
The Infogram is not sensitive to hearing losses that are so severe that speech is inaudible or so mild that they do not affect speech perception. Once speech is inaudible, the pattern of phonetic errors becomes random and no information is transmitted. This is a floor effect. The Infogram is also limited by a ceiling effect at 100% information transmission. For these reasons, the hearing thresholds predicted from the Infogram do not vary much beyond the actual dynamic range of speech signals at each frequency (about 30 to 50 dB range) as illustrated in Figure 6b. The sloping Infogram predicts a greater hearing loss at high frequencies than the flat Infogram at 0% information transmission, indicating that the effects of the individual speech features are not just additive and the shape of the Infogram is also important.
Recommendations and Caveats
An earlier attempt at this study failed because only 10 items were used in the speech test and this resulted in poor repeatability.7 The 50-word SPT overcame this problem. For the best results, the SPT should be performed under controlled conditions:
- If the SPT is presented at a level greater than 65 dB A, the “speech audiogram” may underestimate the hearing loss.
- If the SPT is presented at a level less than 65 dB A or in poor signal-to-noise ratio, the “speech audiogram” may overestimate the hearing loss.
- When the SPT is performed in free field with binaural listening, the “speech audiogram” represents the estimated hearing thresholds in the better ear.
- Monaural thresholds may be estimated with monaural presentation under headphones.
- The current SPT is designed for native speakers of Australian English with a full adult vocabulary. Reduced performance has been observed for non-native English speakers and for people with non-Australian accents. American, New Zealand, and Oxford English versions are under development.
Conclusions
“Speech audiograms” derived from binaural Infograms were highly correlated with conventional audiograms in the better ear and Infograms predicted from conventional audiograms were highly correlated with actual Infograms. Between the floor and ceiling limits that arise from the acoustic characteristics of speech, it is possible to derive a good estimate of the shape and level of the audiogram from the Infogram.
The relationships and equivalence between word test results and audiograms will enable measurement of hearing and hearing aid fitting without specialised equipment or expertise. This is of particular relevance in regions with limited availability of audiologists, audiometers, sound booths, etc.
References
- Kryter KD. Methods for the calculation and use of the articulation index. J Acoust Soc Amer 2005;34.11:1689−97.
- French NR and Steinberg JC. Factors governing the intelligibility of speech sounds. J Acoust Soc Amer 2005;19.1:90−119.
- American National Standards Institute. American National Standard. Methods for calculation of the speech intelligibility index. Washington, DC: Author; 1997.
- Mueller HG, Ricketts TA, Bentler R. Modern hearing aids: pre-fitting testing and selection considerations. San Diego: Plural Publishing; 2014.
- Mueller HG, Ricketts TA, Bentler R. Modern hearing aids: pre-fitting testing and selection considerations. San Diego: Plural Publishing; 2014.
- Miller GA, Nicely PA. An analysis of perceptual confusions among some English consonants. J Acoust Soc Am 1955;27:338−52.
- Blamey PJ. Alternatives to the audiogram for hearing aid fitting. IHCON, August 2012, Lake Tahoe, CA, USA.
Acknowledgments
The SPT is freely available to the public at www.blameysaunders.com.au. The research study was funded by Blamey & Saunders Hearing Pty Ltd. Approval for the study was granted by the Human Research and Ethics Committee of the Royal Victorian Eye and Ear Hospital (Project 14/1164H). The Bionics Institute acknowledges the support it receives from the Victorian Government through its Operational Infrastructure Support Program. Infogram™ is the trademark of Blamey & Saunders Hearing Pty Ltd.
Appendix: Glossary of Features used in the SPT
Nasality is a phonetic feature related to whether the consonant sound comes out of the mouth or the nose. For example, the words “mat” and “bat” start with a nasal /m/ and a non-nasal /b/ respectively. Difficulty hearing the nasality feature makes these words sound alike.
Vowel height is a low-frequency phonetic feature related to tongue height for vowels. For example, the words “court, curt, kit” have low, mid, and high vowels respectively and if they sound alike then you are having difficulty hearing the vowel height cues.
Manner is a phonetic feature related to how consonants are produced, with the acoustic information spread across a wide range of frequencies. For example, the consonant /p/ is a stop, /L/ is a glide, /ch/ is an affricate, /n/ is a nasal and /f/ is a fricative.
Voicing is a low-frequency phonetic feature related to whether your vocal folds are vibrating when you produce consonants. For example, the words “tough” and “duff” have unvoiced /t/ and voiced /d/ consonants at the start. If they sound alike to you then you are having difficulty hearing voicing.
Contour is a mid-frequency phonetic feature related to tongue movement. For example, when you say the words “bout” and “bait” the highest point of the tongue moves backward or forward in the mouth during the vowel. Difficulty hearing the format transitions or contour of sounds makes these words harder to tell apart.
Vowel place is a mid-frequency phonetic feature related to tongue position for vowels. For example, the words “hoard, hard, heed” have back, central, and front vowels respectively. Difficulty hearing vowel place makes these words sound alike.
Vowel length is a phonetic feature related to the duration of vowels. For example, the words “hit” and “heat” have short and long vowels and if they sound alike then you are having difficulty hearing vowel length.
Affrication is a mid-to-high frequency phonetic feature used to classify noisy sounds such as /f/ or /s/ or /v/ that are produced by air rushing through a small constriction in the mouth. If “fin” with “tin” sound alike, for example, this would be an affrication error because the fricative /f/ is confused with the non-fricative /t/.
Sibilance is a high frequency phonetic feature to characterise the /s, z, sh, zh/ consonants. If you cannot hear these consonants clearly then you will have trouble telling whether words are singular or plural, particularly over the phone where high frequencies are often diminished.
Consonant place is a high frequency phonetic feature related to where consonants are produced in the mouth. In English there are seven different places of articulation: glottal, velar, palatal, alveolar, linguadental, labiodental, bilabial. Examples are /h, g, sh, t, th, v, b/. Difficulty hearing consonant place makes the words “gut” and “butt” sound alike. We use a simplified version with only three categories — back, central and front.


