Hearing Aid Delay and Current Drain in Modern Digital Devices

ABSTRACT
Key considerations when hearing aid engineers design new features are processing time (delay) and battery consumption (current drain). While the instructions used to execute various algorithms have become more numerous and complex, hardware improvements have allowed for greater processing speed and improved battery efficiency. There are not many studies that have investigated delay and current drain in modern digital hearing aids. Therefore, the purpose of this report is to provide benchmark and comparative data on these variables as acquired in the context of a yearly AuD student assignment. Seven leading brands of premium hearing aid models spanning a 7-year period and two to three major technology updates were evaluated. All of the measured delays fell into the range that other studies have identified as “tolerable” to the average hearing aid user. There was quite a difference between brands in this measure, but models within each brand tended to have similar delays despite changes in circuitry over the years. With a few exceptions, increases in delay were minimal when the test condition switched from all advanced features OFF to ON. By contrast, current drain was quite variable between brands and across years, with no clear pattern, except for an almost consistent increase (median ~10%) when going from Features OFF to Features ON. A moderately strong relationship between delay and current drain was found with Features ON – a first, to the author’s knowledge.
INTRODUCTION
We generally do not hear much about hearing aid delay these days and it is not usually a specification bragged about in the flashy marketing pieces put out by the various manufacturers. However, occasionally, the topic comes up and we are reminded of its importance in hearing aid design. Delay ranks high on the list of considerations hearing aid engineers pay close attention to along with overall hearing aid size and battery drain. Hearing aid delay, or “throughput delay” if you prefer a more technical engineering term, simply refers to how much time it takes a signal to leave the receiver after it reaches the microphone. With analog devices, the concept of delay never entered the collective consciousness of those who designed or of those who dispensed hearing aids since the number was inconsequentially small. However, with the advent of digital signal processing (DSP) in hearing aids and a convenient means of measuring delay,1 it became the focus of several research studies.2–4
Factors that Influence Delay
The basic premise behind all hearing aid DSP is to convert the continuous time waveform of electrical current from the microphone into a series of numbers that can be strategically manipulated to enhance various properties of the signal. Essentially, the more numbers and the more operations performed on them comes at a cost of processing time. The amount of numbers delivered to the processor depends on the amplitude resolution (bits) and time/frequency resolution (sampling rate) of the analog-to-digital converter. The number and complexity of the operations depend on the sophistication of the various algorithms that drive hearing aid features such as noise reduction and feedback suppression.
Another important determinant of delay is the frequency specificity of the filters used to analyze the incoming signal. While it is not intuitively obvious to someone without training or experience in the art of DSP, digital filters are nothing more than a series of multiplications and summations on the numbers that represent the signal amplitude at each sample in time. A narrow filter with steep slopes requires more samples in time (numbers), or a longer length, than a wide filter with shallow slopes. This reciprocal relationship between time and frequency is more generally summarized by Heisenberg’s Uncertainty Principle, which loosely states that certain relationships between physical properties in nature exist such that the more precisely one property is measured, the less precisely the other can be determined. It is not the length of the filter per se (i.e., the duration of the impulse response) that increases delay because filters operate in the time domain as new samples are acquired. Rather, it is simply the fact that more numbers (previous input and/or output samples) need to be stored and mathematically operated on. In addition, assuming constant filter overlap, if filters are narrow versus wide, more of them will be needed to cover the same bandwidth; and more filters means more processing and more delay.5 Filterbank design is an art form in of itself and several innovative approaches have been implemented over the years in an attempt to balance the tradeoffs in time and frequency.6,7 Without loss of generality, approximately the concepts discussed above apply to frequency analysis techniques that use fast Fourier transform with varying frequency bin spacing.
Besides differences in the way that a signal is sampled, filtered, and subjected to algorithms of varying processing efficiency, differences in delay depend on hardware constraints. In particular, the processor clock rate influences how quickly the mathematical operations or instructions can be issued and the number of transistors on the chipset influences how many of these can be carried out in one clock cycle. In addition, the extent to which the execution of a set of instructions depends on fetching information from memory will influence delay. A chip platform that is more open offers flexibility in the commands it carries out, but relies more on retrieving these commands from memory, which takes time and increases delay. A platform that is more closed has less flexibility because its instructions are printed on the chip, but it also has the advantage of being able to carry them out more quickly and more consistently.
Acoustic and perceptual consequences of delay
When we talk about delay, it is important to understand that delay in of itself is not a problem; after all, recorded signals that are played back later are infinitely delayed. Problems arise when a delayed signal interacts with a non-delayed or relatively less-delayed reference signal. One example that is only a problem for hearing aids when streaming an audio signal from a video display, such as a TV, is audio-video dyssynchrony. In this case, the visual signal is the relatively less-delayed reference. The most common complaint in these situations is that lip movements do not match the sounds that follow. McGrath and Summerfield report that disruptions in audio-visual integration such as these occur when delays begin to exceed about 40 ms for the best lip-readers and about 80 ms for average lip-readers.8 These delays are about an order of magnitude greater than what will be described in the Results section for today’s digital hearing aids when amplifying sounds picked up by the microphone, which is why this phenomenon is not a complaint one would expect from a patient under normal circumstances.
Aside from streaming, the delays that hearing aid engineers have to worry about occur when the reference signal is the bone-conducted signal from the user’s own voice or is the direct sound coming through a large vent or open canal fitting. In these situations, when the two signals are within +/− 10 dB or so, acoustic interactions between them become most prominent.9 In the frequency domain, at relatively shorter delays, a phenomenon known as ‘comb filtering’ occurs.10 It is called this because the acoustic interaction between the two signals results in an alternating pattern of constructive and destructive interference with a frequency spacing equal to the reciprocal of the delay (1/delay). Perceptually, this can result in a change in the timbre or ‘coloration’ of the pitch.10 In the time domain, at relatively longer delays, temporal smearing can result. When this happens, the intensity contrasts between speech segments in the temporal envelope of the direct signal are filled in by the temporal envelope of the delayed signal. Perceptually, speech might be harder to understand and softer segments of speech might become masked by more intense segments in the delayed signal.
Perceptual studies indicate that people are very good at detecting relative audio delay; therefore, the concern for hearing aid engineers has focused on how much delay is tolerable. Tolerable delay is the point at which listeners report being bothered or annoyed by the change in sound quality. Tolerable delay for speech in quiet seems to depend on whether the speech source is the user’s own voice from bone conduction, or if it is others’ voices via the direct acoustic pathway through a large vent or open ear canal. People also seem to be less tolerant of delay when it varies across frequency, as is often the case with hearing aid filtering, whereby relatively narrow low-frequency filters create greater delay compared with wider high-frequency filters.6,7 For speech by others, tolerable delay has been reported to be 24−30 ms when it is constant across frequency and about 15 ms when it is variable.2,3,6,11 However, for the user’s own voice, tolerable delays have been reported to be 9−10 ms.4,10,12,13 Based on these latter data, it seems that 9–10 ms represents an unofficial limit for engineers when designing hearing aids.
Why We Should Care
Modern digital hearing aids have changed a lot since they were first introduced and when delay was a hot topic. Like all digital devices, the hardware capabilities of hearing aids have increased dramatically as processor speeds have increased, transistors have become smaller and more numerous, and memory has become greater and faster. Coincident with these technological advancements, hearing aids are doing more with the signal than ever before and now algorithms are not only carried out on a single stream of numbers but on two streams in the case of dual omni directional microphones or even four streams as the full audio signal from one device is wirelessly transmitted to the other. With all of these changes in hearing aids, it is evident that there is not a lot data to establish a benchmark for what might be considered a “typical” hearing aid delay, which is the purpose of this study.
METHODS

The author is pictured with some of the students responsible for data collection.
Data were collected by second-year doctor of audiology students at Purdue University from 2009 to 2015 as part of a class assignment. The Frye Fonix 7000 Hearing Aid Test System was used to measure delay as described on page 102 in the Fonix 7000 Operator’s Manual Version 1.63:
“The digital processing delay measurement is taken by sending a short impulse from the sound chamber speaker to the hearing aid. The 7000 Test System microphone collects information from the hearing aid for 20 milliseconds from the time the impulse is delivered. This information is a series of numbers of varying amplitudes. The 7000 Test System finds the maximum peak amplitude of the resulting information. Since the impulse response of a hearing aid is not always simple, the analyzer also checks for any peaks occurring before this maximum peak. If a smaller peak exists, and it has an amplitude of at least 50% of the maximum peak, the time of the smaller peak will be considered the processing delay point. Otherwise, the time of the maximum peak will be considered the processing delay point. The 7000 Test System delay is subtracted from this delay point in order to form the actual aid processing delay time. (The 7000 Test System delay is determined during the sound chamber leveling process.)”13
Students were instructed to research their assigned hearing aids and to use the programming software to set each hearing aid in one of two conditions: all advanced features deactivated (Features OFF) and all advanced features activated (Features ON). Hearing aids were programmed for a 50-dB HL flat hearing loss using the manufacturers’ default settings for gain. Only one hearing aid in each pair was tested, therefore, hearing aids with ear-to-ear wireless capabilities were tested without this feature activated. Using a 65-dB SPL composite speech input, the test was repeated three times and the average was reported.
Many of the same factors that may influence delay may also influence battery current drain. Therefore, as part of the same class assignment, students conducted measurements of battery current drain using the same hearing aids and conditions as were used for the measurements of delay. Battery current drain was measured for a 65-dB SPL composite speech input using the appropriate battery substitution pill and Frye Fonix 7000 Hearing Aid Test System.
Seven major brands of hearing aids, arbitrarily labeled “A” through “G,” were tested. All hearing aids were either behind-the-ear or receiver-in-the-canal (open canal) devices. The individual hearing aid models were manufactured between 2009 and 2015. However, for the sake of this report, hearing aid models are labeled according to the year that they were first introduced to the market, 2008–2014, with a few pre-2008 models being labeled as “2008” for ease of discussion. Given that manufacturers introduce major technology updates to their hearing aid chipsets about every two years, the span of years reported captures two to three major technology updates per brand.
Almost all of the models were the highest level of technology (‘premium’) offered by the manufacturer at the time they were acquired. For the few mid-level models (6 out of 38 models), it was usually the case that they were acquired together with the premium model. Therefore, almost of the data points (see the following data reduction procedure) include at least one premium model. Within the limited dataset of co-acquired mid- and premium-level models, there were no obvious differences in the measurements for delay and battery current drain.
Across all of the student cohorts, results for 62 hearing aids were reported to the author. Measurements for the Features OFF condition were not collected by the 2009 class (“2008” models, n = 7). Furthermore, two measurements for delay and one measurement for battery current drain, both with Features ON, were excluded from the average because they were unrealistically too low or too high. Several models were tested by two or three student cohorts (the same aid may or may not have been tested multiple times since students chose to test either the left or the right hearing aid from each pair) and, as mentioned, some of the tested models were introduced in the same year by the same manufacturer. In addition, new models by each of the manufacturers were not released/acquired every year. Therefore, when the 62 student reports were collapsed across Brand and Year, only 31 out of 49 possible data points (7 Brands times 7 Years) were available for reporting.
RESULTS
The average delay by Brand and Year is displayed in Figure 1. The lines show data for the Features OFF condition and the symbols show the data for the Features ON condition. Each brand is shown with a different color. Recall that only 31 of the Brand by Year combinations were collected, therefore, lines without data points for a given year were automatically interpolated. Interpolated data points in the lines (Features OFF) can be determined by examining the years for which no symbol (Features ON) is shown (e.g., Brand G for years 2010 – 2012). A few interesting patterns emerge from an examination of Figure 1:
- All of the reported delays were less than 8 ms, which confirms that the 9-10 ms mark seems to represent an unofficial limit that hearing aid engineers consciously avoid.
- There were major differences between manufacturers, with delays as low ~2 ms and delays as high as ~7 ms.
- With a few exceptions, these differences maintained over the years because delays were relatively consistent within a manufacturer despite major technology updates. The primary exception was Brand D, which went from 2–3 ms delays (second lowest) pre-2011 to ≥ 6 ms delays (third highest) post-2011. Brand C also demonstrated almost as large of an increase in absolute delay over the same period when tested with Features ON. The most obvious change over this period for both brands was the inclusion of a new wireless platform.
- Delays with Features ON (symbols) were minimally impacted compared with Features OFF (lines) for most brands. The median delay with Features OFF was 5.27 ms and the median delay with Features ON was 5.36 ms. Again, the biggest exceptions were Brands C and D, which almost consistently had greater delays with Features ON than with Features OFF, even for pre-2011 data points.
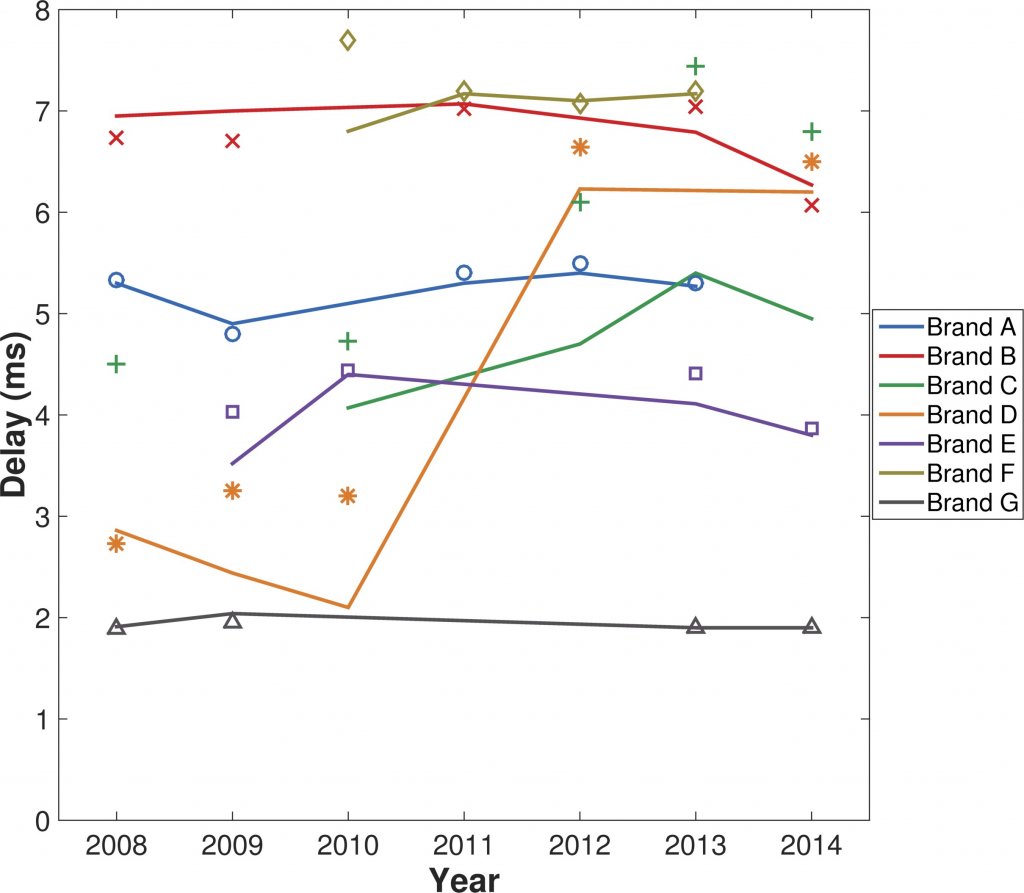
Figure 1. Plot showing the average delay in milliseconds (ms) for each of seven leading brands of hearing aids (different colour lines and symbols) first manufactured in 2008 – 2014. Data representing measurements with all advanced features OFF are plotted as lines and those with all advanced features ON as symbols. For various reasons, not every Brand by Year combination was available and/or measured, therefore, some line segments were automatically interpolated (determined by examining the years for which no corresponding symbol is plotted).
The average battery current drain by Brand and Year is displayed in Figure 2 in the same manner as Figure 1. Unlike the data for delay, the data for battery current drain was much more variable with no consistent trends across Year or across Brand. One feature in the dataset that does seem to be consistent is that Brand G had the lowest current drain with Features ON and among the lowest with Features OFF across all of the years reported. It should be noted that this brand also had the shortest delays (more on this later). The other consistent pattern is that, in almost every case, Features ON showed a measureable increase in current drain compared with Features OFF. The median current drain with Features OFF was 1.26 mA and the median current drain with Features ON was 1.39 mA, or about a 10% increase.
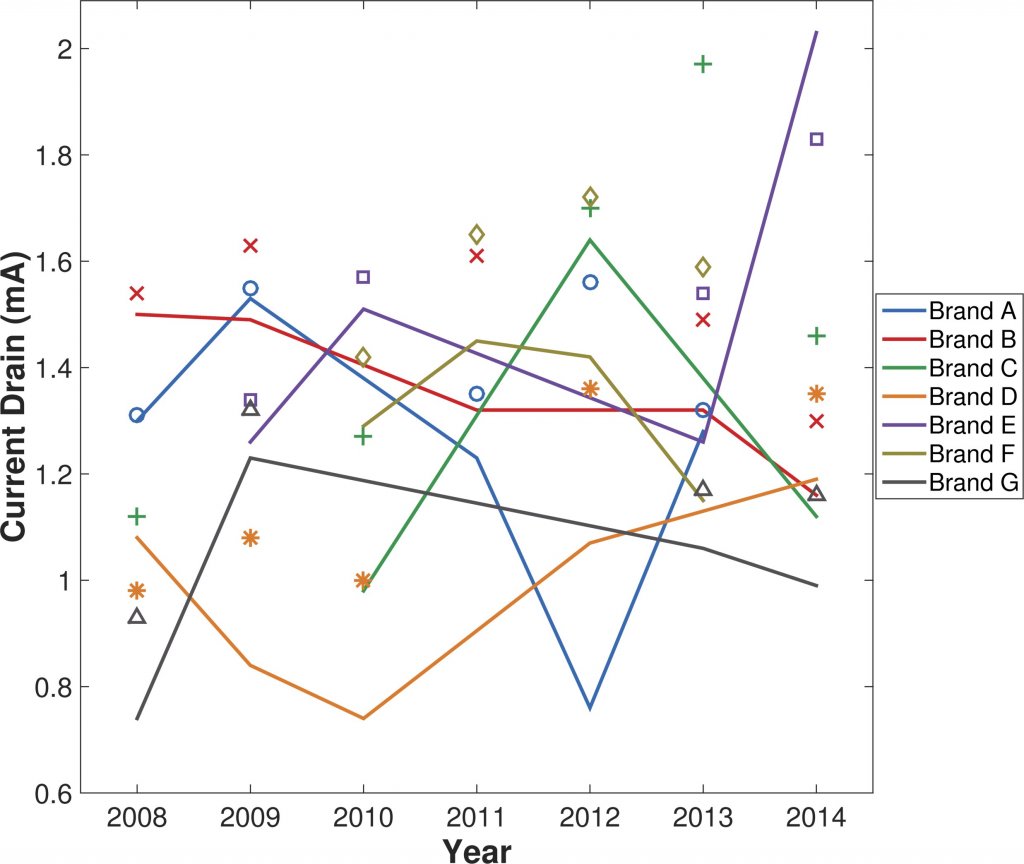
Figure 2. Plot showing the average battery current drain in milliamperes (mA) for the same hearing aid models shown in Figure 1 (see caption).
Since battery life for a given current drain is determined by the battery capacity (with bigger batteries having greater capacity as measured in milliamp hours, mAh), it is more meaningful to compute the percent change in current drain associated with the activation of the hearing aid features. Figure 3 shows the rank-ordered distribution of the percent change in current drain for each of the 31 cases reported in Figure 2. Only two of the cases showed a net decrease in current drain associated with Features ON. Whether these were real or the result of measurement error is not known. The same can be said for the case that demonstrated over a 50% increase in current drain with Features ON. The horizontal lines on the figure correspond to the first quartile (5.33%, dotted line), median (11.76%, solid line), and third quartile (20.72%, dashed line). In terms of battery life, assuming a typical 10 days between battery changes, a quarter of users would only experience a half day or less decrease in battery life with all Features ON compared with all Features OFF and another quarter would experience a decrease in battery life of 2 days or more. The majority of users would get about 1 day less life out of their battery. Assuming a bilateral fitting and $0.75 (USD) per battery, this translates into about 4 to 18 batteries, or about $3.00 to $13.50 (USD), per year for all Features ON versus all Features OFF. Arguably, this is a small price to pay for the extra value-added benefit that some of the features can provide.
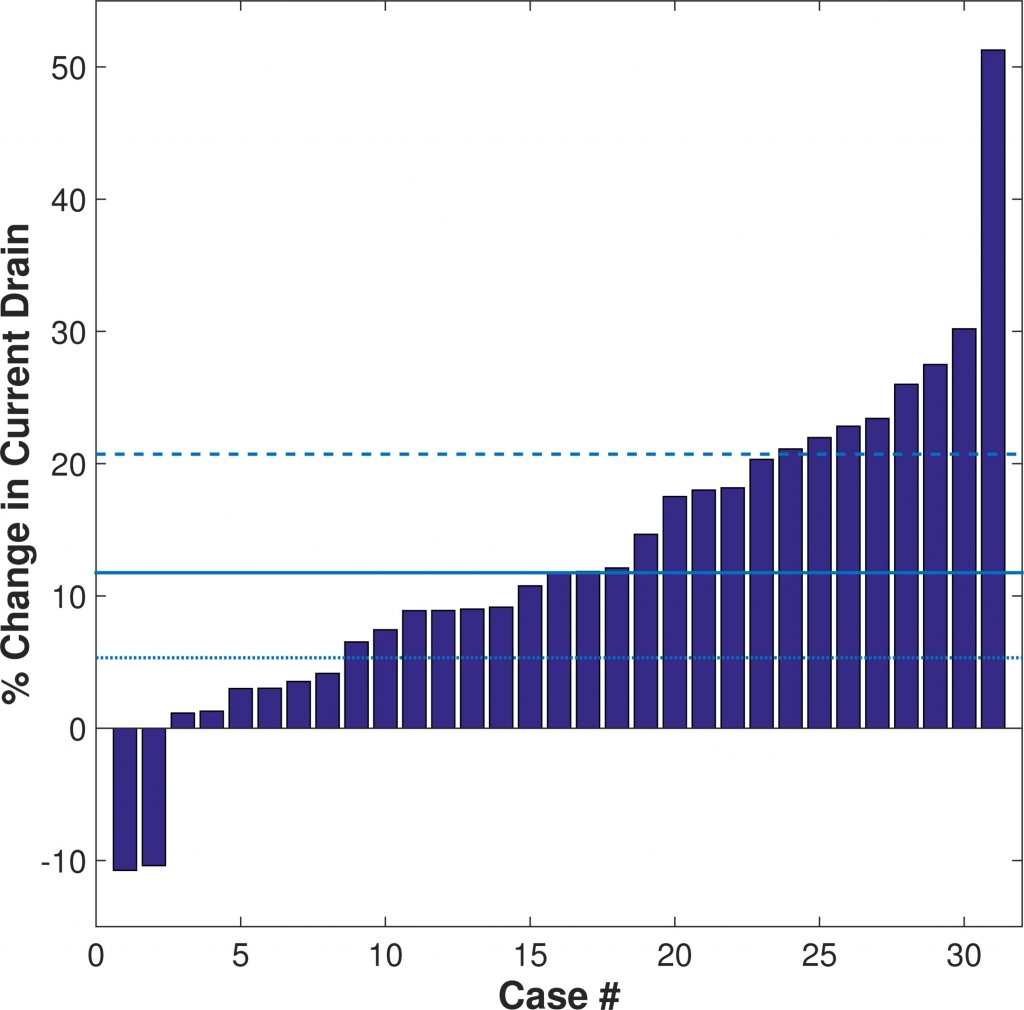
Figure 3. Rank-ordered distribution of the percent change in current drain associated with hearing aid feature activation for the data shown in Figure 2. Horizontal lines correspond to the first quartile (dotted line), median (solid line), and third quartile (dashed line).
Figure 4 provides a further inspection of the data shown in Figure 3. Plotted using the same colours and symbols as Figures 1 and 2 is the percent change in current drain sorted by Brand and Year. There is no clear pattern of increase or decrease in the percent change in current drain by Year, with the exception of Brand F, which showed a progressive increase each year from 2010 to 2013. It is also difficult to discern a clear pattern by Brand since the rank ordering tends to vary by Year. Broadly, Brands C and D tended to exhibit the among highest percentage increases in current drain across the years with Features ON versus Features OFF. Recall, that these brands also tended to exhibit the largest increases in absolute delay under these same conditions.

Figure 4. Data from Figure 3 replotted using the same colors and symbols as Figures 1 and 2 to show the percent change in current drain sorted by Brand and Year.
Figure 5 plots the values for battery current drain against the values for delay. Data points for Features ON and OFF are displayed with filled and open circles, respectively. As shown, generally, as delay increased so did current drain, especially with Features ON. To test the association between delay and current drain, separate Pearson correlations were computed between these two variables for Features ON and Features OFF. The analyses revealed a significant correlation between delay and current drain with Features OFF [r = 0.41, t(29) = 2.406, p = 0.02] and a larger correlation with Features ON [r = 0.66, t(30) = 4.815, p < 0.001]. These analyses broadly support the hypothesis that the same hardware and software properties that increase delay also are responsible for an increase in current drain.
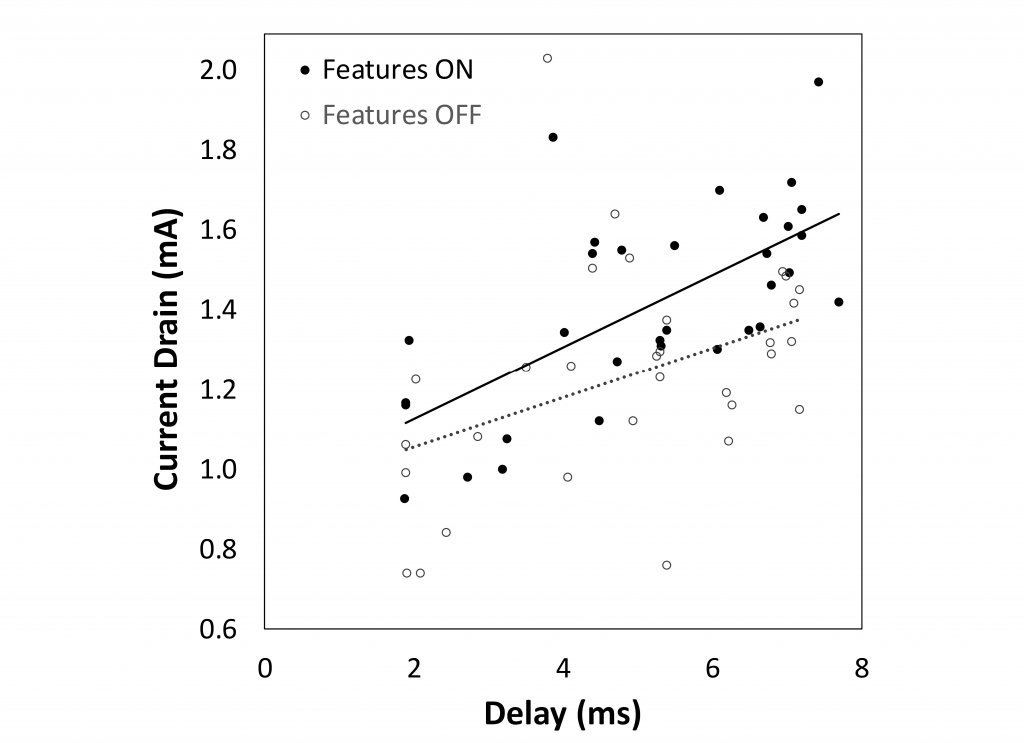
Figure 5. Values for battery current drain plotted against the values for delay. Data points for Features ON and OFF are displayed with filled and open circles, respectively. The solid black line is the regression fit to the Features ON data [R2 = 0.44] and the dotted gray line is the regression fit to the Features OFF data [R2 = 0.17].
DISCUSSION
The purpose of this study was to provide benchmark and comparison data for throughput delay and battery current drain in a representative set of devices that contained the most significant technology updates to digital hearing aids in the last 10 years or so. These two factors, along with the size of the housing that sits in or behind the ear, represent some of the most important limitations hearing aid engineers must pay attention to when designing a new hearing aid because consumers want hearing aids that look and sound good and without the inconvenience of having to frequently purchase and replace batteries. An examination of the current state of technology is particularly relevant in light of new findings that indicate that normal-hearing and hearing-impaired adults have a much higher tolerance for delay when speech is presented in noisy environments.15,16 This information along with advances in battery technology, such as effective rechargeablity, might change the extent to which hearing aid engineers allow these to be limiting factors in designing sophisticated algorithms and features that can help hearing aid users in the situations where they need the most help.
Seven leading brands of premium hearing aid models spanning a 7-year period and two to three major technology updates were evaluated. Delays were consistently < 8 ms, and with a few exceptions, they were relatively constant within a brand but quite variable across brands for the years tested. Furthermore, the median increase in delay associated with activation of all or most of the hearing aid features (Features ON) was about < 0.1 ms and only two brands showed a consistent increase in this condition. With respect to battery current drain, there was no consistent pattern by Year or Brand. However, there was an almost ubiquitous pattern of increased current drain associated with the Features ON condition, with a median increase of around 10–12% and an interquartile range spanning 5–20%. As reviewed in the Introduction, DSP factors that tend to increase delay should also tend to increase battery current drain. This hypothesis was supported in the present study, which is the first that the author is aware of that demonstrates a statistically significant relationship between these two dependent variables (see Figure 5).
Besides the fact that the hearing aids were not actively using their wireless features, there is another important consideration that may affect the validity of the results. It was thought that a broadband input signal presented at an average speech level would be a more valid input signal compared with a series of tonal inputs as is often used to measure delay, especially when frequency specific estimates are desired. While this might be true, it is also known that some DSP strategies result in frequency specific delay, with greater delay in the low frequencies than the high frequencies.5,6,7,14 With a broadband signal, it is less certain which frequency is responsible for the delay reported by the equipment. According to the description provided in the Fonix 7000 Operator’s Manual, the time at which the highest amplitude in the waveform occurs (within 6 dB) is used to mark the delay. For a flat 50-dB HL audiogram, the mid-frequencies (around 2–3 kHz) will likely have the highest amplitudes because the low frequencies are usually prescribed relatively less gain to account for the fact that speech is more intense in this part of the spectrum and the high frequencies are limited by the receiver response.
For those instruments where delay is more or less constant across frequency, then the measurements shown in Figure 1 have greater validity. However, if delay varies across frequency, then the reported values likely underestimate the delay at low frequencies and over estimate it at high frequencies. For example, Herbig and Chalupper report frequency specific delay values for one of the models reported in the present study.5 The values in the 2–3 kHz region reported for digital noise reduction OFF and ON were similar to the values reported for the same hearing aid model in this study for the Features OFF and ON conditions, respectively. However, Herbig and Chalupper report about 1 ms less delay at 5 kHz and about 3 ms greater delay at 0.5 kHz.5 Differences in the frequency profile for delay can create difficultly when trying to make comparisons between models/brands and it might even call into question comparisons between Features OFF versus ON if the peak frequency in the overall response changes when a certain feature or combination of features are activated. Despite these possible shortcomings, the data reported here are a good approximation of delay in the frequency regions most important for speech understanding.
REFERENCES
- Frye G. Testing digital and analog hearing instruments: Processing time delays and phase measurements. Hear Rev 2001;8(10):34–40.
- Stone MA, and Moore BCJ. Tolerable hearing aid delays. I. Estimation of limits imposed by the auditory path alone using simulated hearing losses. Ear Hear 1999;20:182–92.
- Stone MA and Moore BCJ. Tolerable hearing aid delays. II. Estimation of limits imposed during speech production. Ear Hear 2002;23:325–38.
- Agnew J and Thornton JM. Just noticeable and objectionable group delays in digital hearing aids. J Am Acad Audiol 2000;11:330–36.
- Herbig R and Chalupper J. Acceptable processing delay in digital hearing aids. Hear Rev 2010;17(1):28–31.
- Kates JM. Principles of digital dynamic-range compression. Trend Amplif 2005;9:45–76.
- Kates JM. Digital hearing aids. San Diego, CA: Plural Publishing; 2008.
- McGrath M and Summerfield Q. Intermodal timing relations and audiovisual speech recognition by normal-hearing adults. J Acoust Soc Amer 1985;77:678–85.
- Dillon H. Hearing Aids, 2nd Ed. New York: Thieme; 2012.
- Bramsløw L. Preferred signal path delay and high-pass cut-off in open fittings. Int J Audiol 2010;49:634–44.
- Cole W. Group delay and processing delay in hearing aids: The facts and the fantasies. Audio Note 3. Dorchester, ON: Etymonic Design Inc; 2005.
- Groth J and Søndergaard MB. Disturbance caused by varying propagation delay in non-occluding hearing aid fittings. Internat J Audiol 2003;43:594–99.
- Stone MA, Moore BCJ, Meisenbacher K, and Derleth RP. Tolerable hearing aid delays. V. Estimation of limits for open canal fittings. Ear Hear 2008;29:601–17.
- Frye Electronics, Inc. Fonix 7000 Hearing Aid Test System Operator’s Manual Version 1.63. Tigard, OR: Frye Electronics, Inc; 2007.
- McKinney MF, Burwinkel JR, and Zhang T. Maximum acceptable delay in hearing aids under noisy conditions. Poster session presented at the Annual Scientific and Technology Conference of the American Auditory Society, Scottsdale, AZ; 2015.
- Burwinkel JR, McKinney MF, and Galster J. Acceptable hearing aid throughput delay for listeners with hearing loss under noisy conditions. Poster session presented at the Annual Scientific and Technology Conference of the American Auditory Society, Scottsdale, AZ; 2016.
Addendum
The author wishes to acknowledge Dr. Wayne Staab for motivating the analyses conducted in this paper. Dr. Staab reported separate analyses of the same dataset and previously reported on hearing aid delay and battery current drain in a series of articles that can be found on in the January and February 2016 archives of http://hearinghealthmatters.org/waynesworld/2016.