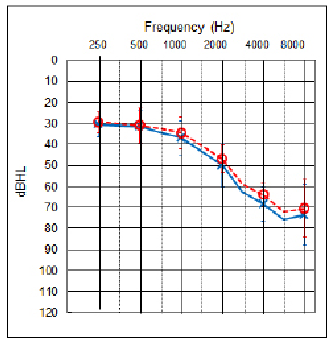
Figure 1. The average audiogram for the 10 subjects, with the standard deviations shown as the vertical bars at the respective audiometric frequencies. By