A Canadian Evaluation of Real-Life Satisfaction of Hearing Aids in Challenging Environments

Technological advances in hearing aids evolve rapidly and are made available to clinicians often without clinical data to support their efficacy. Sound clinical practice necessitates that a clinician makes evidence-based decisions when recommending or prescribing hearing aids to their clients.1,2 In the absence of research data, the clinician is forced to rely upon weaker forms of evidence such as expert opinion and clinical observation to judge the worth of any hearing aid technology. Stronger forms of evidence require scientific study and the collection of research data. This evidence becomes even more robust if conducted within the community or culture in which these clinical decisions are made. A Canadian-based clinical trial has been conducted across the country with the aim of providing empirical evidence of the efficacy of the Widex U-platform.
Methods
This clinical study was run through the Widex Patient Experience Program (PEP). It was conducted from September 22nd to December 8th, 2015 and included 54 subjects at 24 clinics across Canada. Patients were asked to evaluate the Widex Unique 440 Fusion (U-FS 440) hearing aid and to compare it to their existing/current hearing aids. A subjective satisfaction survey based upon the MarkeTrak IX questionnaire was utilized.3
Participating Clinics
Clinics across the country were selected to participate to ensure a broad and representative sample of study participants to represent real clinic practices across Canada. Participating clinicians and clinics are listed in Figure 1.
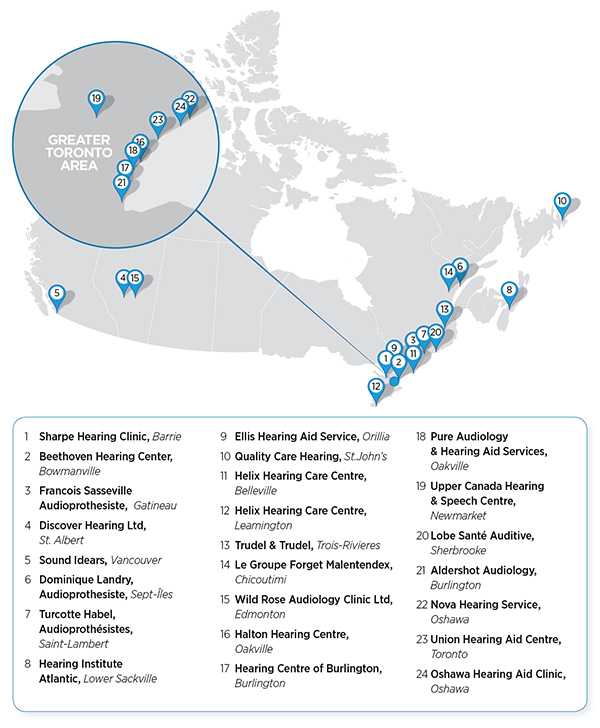
Figure 1. Participating clinics.
SUBJECT INCLUSION CRITERIA
To provide data suitable for real clinic conditions, a broad subject selection criteria was paramount to the PEP. Subjects were not excluded based upon type or configuration of hearing loss. Hearing loss exclusion criteria was based upon the fitting range of U-FS 440. Prescription gain targets were required to be within the fitting range of U-FS 440 using standard, medium or power receivers. Hearing aids were programmed and fit using Widex’s proprietary fitting software and targets (Compass GPS). Experienced, non-Widex previous hearing aid users were preferred. Consequently, the study included experienced users currently wearing hearing aids produced by all major manufacturers in Canada. Of the 54 subjects in the study, 50 were experienced users, 33 used non-Widex hearing aids and 17 used Widex hearing aids. This multi-manufacturer sample eliminates bias towards subjects being pre-conditioned to a specific hearing aid manufacturer’s sound.
PROCEDURE SUMMARY
All clinicians were provided with procedural instructions to execute the study in their clinic. When clinicians initially consulted prospective candidates for the study, they were transparent in their explanation as to the clinical study inclusion criteria. Once the study was completed, subjects were given the opportunity to purchase the new hearing aids. Following acceptance of the subject to the program, evaluation protocols were able to begin.
All patients were assessed, fit and counselled in accordance with best practice procedures as deemed appropriate by the clinics where the assessment, fitting, and follow up took place.
Subjects were first provided Satisfaction Questionnaire #1 (SQ1) to evaluate the performance of their current hearing aids. Questions pertaining to hearing aid features are outlined in Figure 2, and those pertaining to listening environments are outlined in Figure 3. Ratings were provided on a subjective 25-item, 7-point scale that ranged from “1” -- “completely dissatisfied” to “7” -- “completely satisfied”, with a rating of “4” being “neutral.”
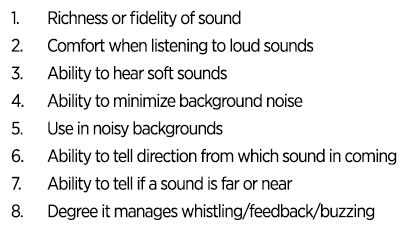
Figure 2. Hearing aid features.
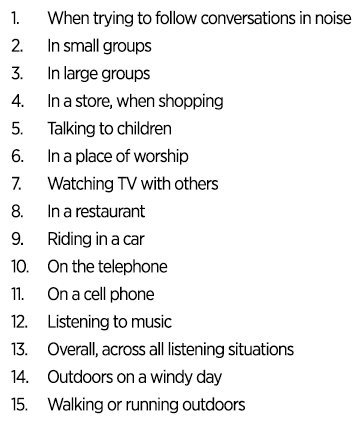
Figure 3. Listening environments.
Subsequently, patients were assessed and fit with U-FS 440 hearing aids. After a period of one month, they were provided with Satisfaction Questionnaire #2 (SQ2). Following completion and submission of data from all clinics, the data was compiled and statistically evaluated. Corresponding items from SQ1 and SQ2 were paired and the overall difference scores were calculated. Statistical significance of the overall difference scores were calculated using both the Paired t-test and Wilcoxon Signed-Rank test.
Results
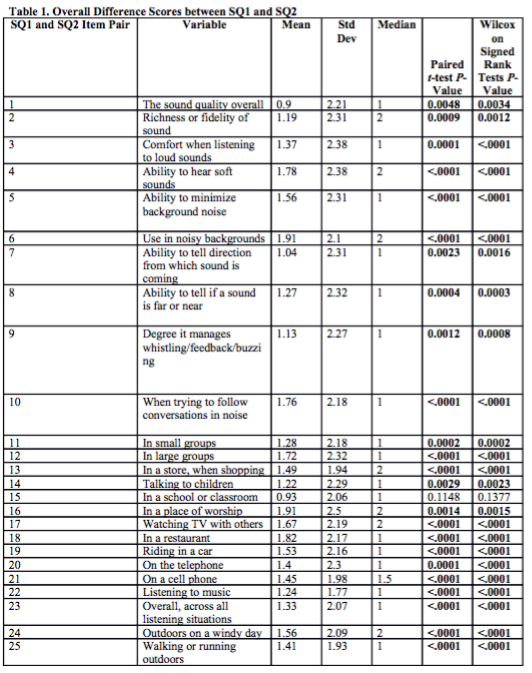
Results indicated a clear improvement in SQ2 compared to SQ1 scores across all items. Results are presented for each set of paired items, corresponding to the relevant hearing aid feature or listening situation. Table 1 displays the mean difference scores and statistical significance for each item pair. For each pair, the mean difference is positive. This positive difference indicates a better score (higher subjective rating) for each item on SQ2 compared to SQ1. A significant P-value (P < 0.05, for both Paired t-tests and Wilcoxon Signed-Rank tests) indicates a statistically significant difference in scores between SQ2 and SQ1. This difference was statistically significant for every condition with the exception of pair 15.
This means that for every measured condition but one, subjective ratings of hearing aid satisfaction were significantly improved with U-FS 440 hearing aids, relative to subjects’ current hearing aids.
This result is best exemplified by sampling the distributions of the individual item pairs themselves. The distributions clearly indicate a significant shift of the curve to the right (towards improved satisfaction), while wearing U-FS 440 hearing aids, for six key variables. These six variables that are typically problematic for hearing aid users are: Overall Sound Quality, Richness and Fidelity of Sound, Ability to Hear Soft Sounds, Use in Noisy Backgrounds, In a Restaurant, and Walking or Running Outdoors.
Item Pair 1: The Overall Sound Quality
On SQ1, when participants rated their current hearing aids’ Overall Sound Quality, 10 respondents (19%) rated “dissatisfied”, 11 (21%) “neutral” and 31 (60%) “satisfied”, with only 4 respondents (8%) reporting a satisfaction score of 7 (Figure 4). When evaluating the Overall Sound Quality with U-FS 440 on SQ2, 8 respondents (15%) reported “dissatisfied”, 4 (8%) “neutral” and 40 (77%) “satisfied” with 21 respondents (40%) reporting a score of 7 (Figure 4).
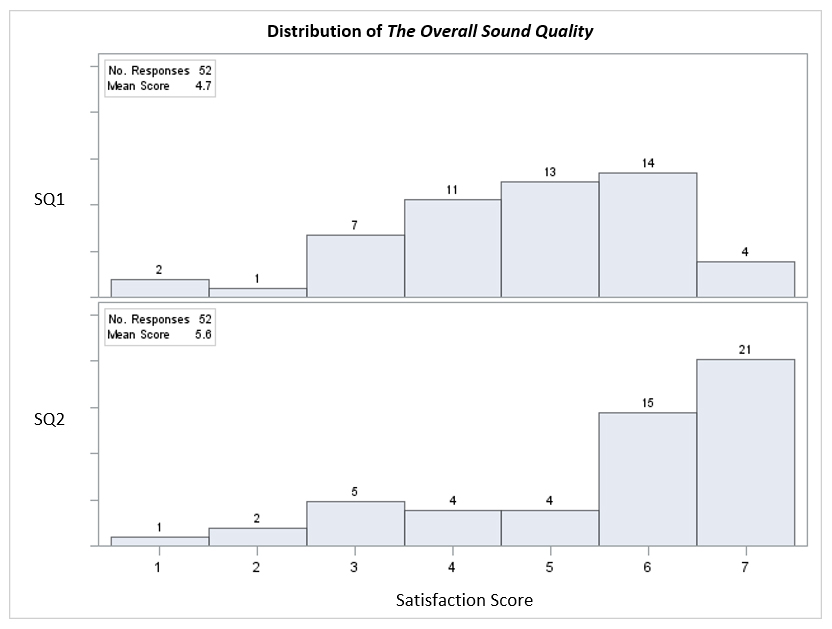
Figure 4. Distribution of the overall sound quality.
The left to right shift that is evident when comparing the distributions of SQ1 and SQ2 in Figure 4 indicates a clear movement of respondents at each satisfaction level toward being more satisfied. The mean shift per subject is 0.9. The largest increase was at the satisfaction rating of “7” where 17 additional subjects selected this score on SQ2 compared to SQ1.
Item Pair 2: Richness and Fidelity of Sound
When evaluating Richness or Fidelity of Sound for SQ1, 12 respondents (24%) rated “dissatisfied”, 14 (29%) “neutral” and 23 (47%) “satisfied”, with only 3 respondents (6%) reporting a satisfaction score of “7” (Figure 5). When evaluating the Richness or Fidelity of Sound with U-FS 440 on SQ2, 9 (18%) respondents reported “dissatisfied,” 4 (8%) “neutral” and 37 (74%) “satisfied” with 17 (34%) reporting a satisfaction score of “7” (Figure 5).
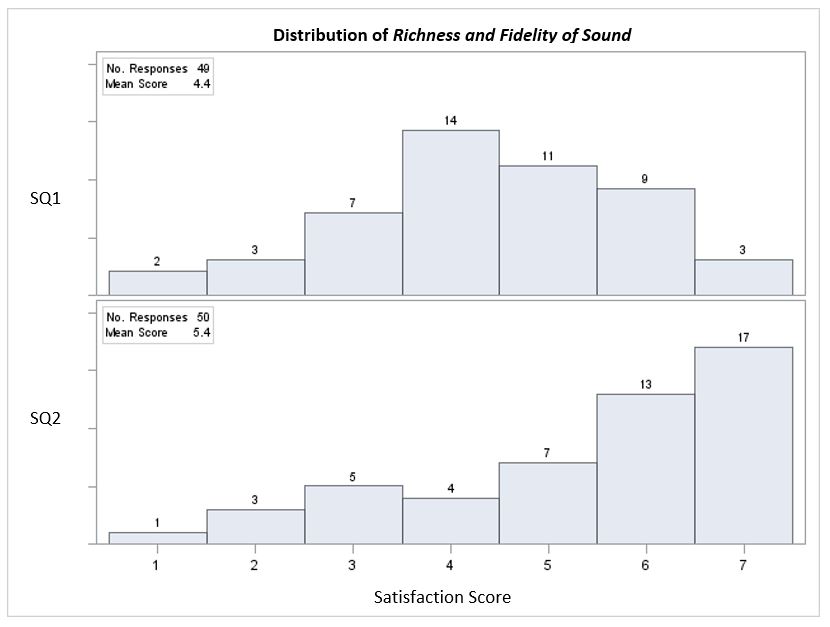
Figure 5. Distribution of richness and fidelity of sound.
The left to right shift seen when comparing distributions of SQ1 and SQ2 in Figure 5 indicates a clear movement of respondents at each satisfaction level toward being more satisfied with U-FS 440. The mean shift per subject is 1.2. The largest increase was at the satisfaction rating of “7” with 14 more subjects on SQ2 compared to SQ1. The next largest change was at the “neutral” rating where 10 fewer respondents rated at “neutral” on SQ2 compared to SQ1, and were clearly shifted in to the “satisfied” range.
Item Pair 4: Ability to Hear Soft Sounds
When evaluating Ability to Hear Soft Sounds on SQ1, 25 (49%) respondents rated “dissatisfied”, 4 (8%) “neutral” and 22 (43%) “satisfied”, with only 1 (2%) respondent reporting a satisfaction score of “7” with their ability to hear soft sounds (Figure 6). When evaluating the Ability to Hear Soft Sounds with U-FS 440 on SQ2, 9 respondents (18%) reported “dissatisfied,” 5 (10%) “neutral” and 37 (73%) “satisfied” with 20 (39%) reporting a satisfaction score of “7” (Figure 6).
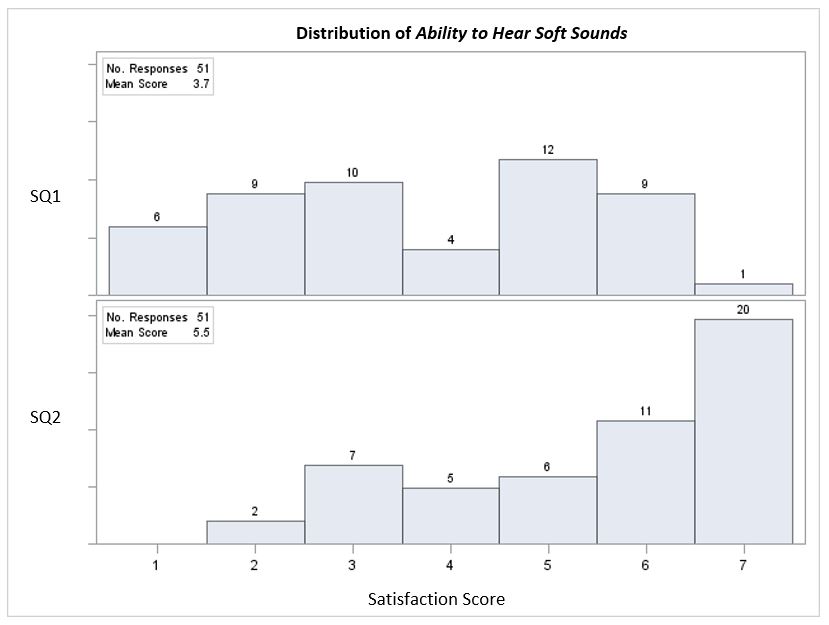
Figure 6. Distribution of ability to hear soft sounds.
The left to right shift seen when comparing distributions of SQ1 and SQ2 in Figure 6 indicates a clear movement of respondents at each satisfaction level toward being more satisfied with the U-FS 440. The mean shift per subject is 1.8. The largest increase was at the satisfaction rating of “7” with 19 more subjects on SQ2 compared to SQ1. In addition, there was a shift of 6 subjects on SQ1 to 0 subjects on SQ2 who reported a score of “1,” complete dissatisfaction.
Item Pair 6: Use in Noisy Backgrounds
When evaluating Use in Noisy Backgrounds on SQ1, 34 (67%) rated “dissatisfied”, 4 (8%) “neutral” and 13 (25%) “satisfied”, with only 1 (2%) respondent reporting a satisfaction score of “7” (Figure 7). When evaluating Use in Noisy Backgrounds with U-FS 440 on SQ2, 15 (32%)respondents reported “dissatisfied”, 4 (9%) “neutral” and 28 (60%) “satisfied” with 11 (23%) reporting a satisfaction score of “7” (Figure 7).
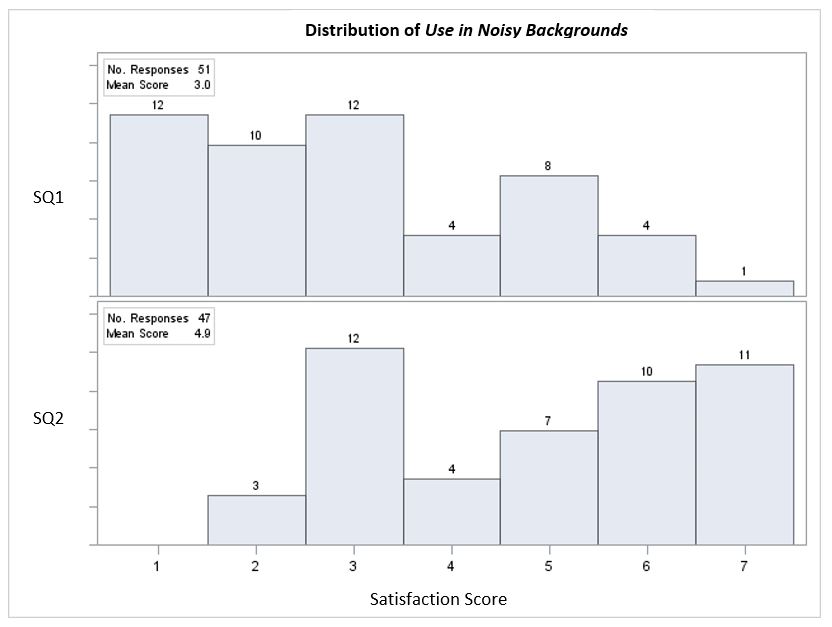
Figure 7. Distribution of use in noisy backgrounds.
The left to right shift seen when comparing distributions of SQ1 and SQ2 in Figure 7 indicates a clear movement of respondents at each satisfaction level toward being more satisfied with the use of U-FS 440 in noisy environments. The mean shift per subject is 1.9. The largest increase was at the satisfaction rating of “7” with 10 more respondents on SQ2 compared to SQ1 and zero respondents indicated a score of “1” on SQ2. The largest overall shift was 19 fewer respondents remaining in the “dissatisfied” category for SQ2 compared to SQ1.
Item Pair 18: In A Restaurant
When evaluating satisfaction In a Restaurant on SQ1, 34 (68%) rated as “dissatisfied”, 4 (8%) “neutral” and 12 (24%) “satisfied,” with only 1 (2%) respondent reporting a satisfaction score of “7” (Figure 8). When evaluating In a Restaurant with U-FS 440 on SQ2, 10 (22%) respondents reported “dissatisfied”, 7 (16%) “neutral” and 29 (64%) “satisfied” with 15 (33%) reporting a satisfaction score of “7” (Figure 8).
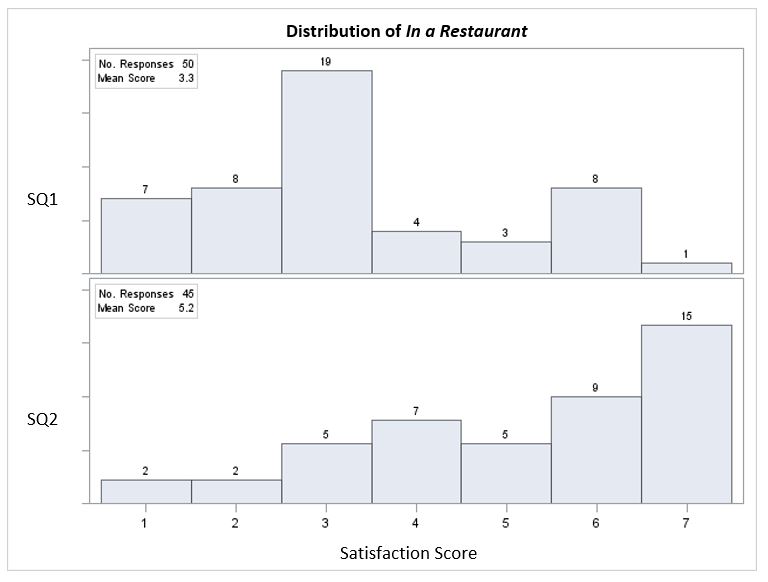
Figure 8. Distribution of use in a restaurant.
The left to right shift seen when comparing distributions of SQ1 and SQ2 in Figure 8 indicates a clear movement of respondents at each satisfaction level toward being more satisfied with U-FS 440. The mean shift per subject is 1.8. The shift is clearly seen by evaluating the mode, where there is a shift from a mode of “3” for SQ1 to a mode of “7” for SQ2. The largest increase was at the satisfaction rating of “7” with 14 more respondents on SQ2 compared to SQ1. The largest overall shift was 19 fewer respondents remaining in the “dissatisfied” category on SQ2 compared to SQ1.
Item Pair 25: Walking or Running Outdoors
When evaluating satisfaction when Walking or Running Outdoors on SQ1, 14 (28%) respondents rated as “dissatisfied,” 14 (28%) “neutral” and 22 (44%) “satisfied”, with only 4 (8%) respondents reporting a satisfaction score of “7” (Figure 9). When evaluating Walking or Running Outdoors with U-FS 440 on SQ2, 5 (11%) respondents reported “dissatisfied”, 5 (11%) “neutral” and 37 (78%) “satisfied” with 20 respondents (43%) reporting a satisfaction score of “7” (Figure 9).
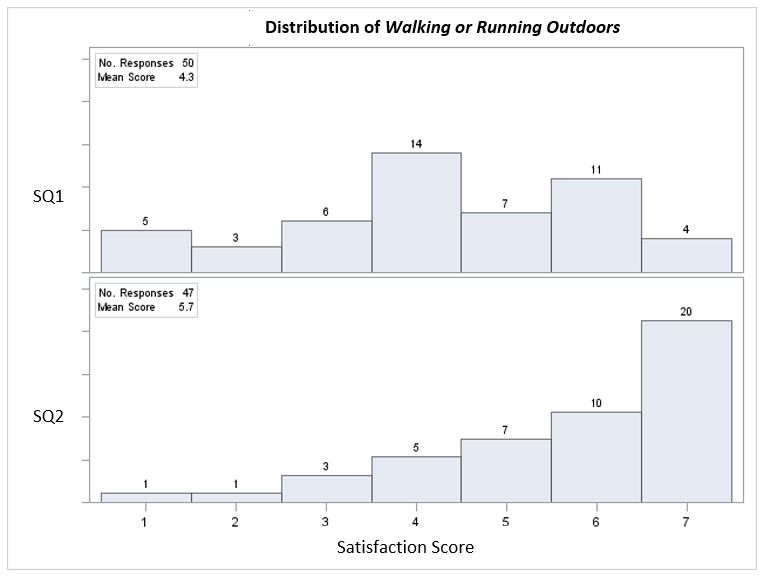
Figure 9. Distribution of Walking or Running Outdoors.
The left to right shift seen when comparing distributions of SQ1 and SQ2 in Figure 9 indicates a clear movement of respondents at each satisfaction level toward being more satisfied with U-FS 440. The mean shift per subject is 1.4. The largest increase was at the satisfaction rating of “7” with 16 more respondents on SQ2 compared to SQ1.
Summary
Overall data clearly indicates an improvement in user satisfaction when subjects were wearing U-FS 440 hearing aids. The mean and median difference results across all item pairs show the statistically significant improvement from SQ2 compared to SQ1. Examination of all 25 paired distributions, highlighted in Figures 4–9, show a shift from left to right, from dissatisfaction to satisfaction. This is true not just for the overall categories of satisfaction and dissatisfaction, but a shift at each individual response level. This suggests that regardless of where the patient sits on the satisfaction scale for a particular condition, their satisfaction shifted in the positive direction with U-FS 440 hearing aids. This is consistent across all paired conditions.
Clinical Implications
The PEP clinical study demonstrates significant improved satisfaction with Widex Unique 440 Fusion hearing aids in all environments, as compared to the users’ current hearing aids, independent of manufacturer. Users reported increased satisfaction ratings across all listening categories. The improvement is clearly seen in the highlighted qualities overall sound quality, richness and fidelity of sound, ability to hear soft sounds, use in noisy backgrounds, in a restaurant, and walking or running outdoors.
When prescribing or recommending hearing aids for users, the primary concern for most clinicians is that the new hearing aids result in perceptible improvement in communication challenges that the users face. Intuitively, clinicians have an understanding that premium technology provides increased user benefit; however, there are limited Canadian clinical data sets to indicate this is the case. This clinical study demonstrated significant improvement when wearing U-FS 440 hearing aids compared to users’ current hearing aids, independent of manufacturer. The PEP took place in natural clinical settings, with clinical conditions, such as patient needs and clinical practices, which are representative of those encountered by Canadian hearing health care professionals. This study supports a direct application of its results to real-life clinical settings in Canada, that the premium technology on the Widex U-platform brings substantial improvement to hearing aid user satisfaction.
REFERENCES
- Dollaghan C. The handbook for evidence-based practice in communication disorders. Baltimore, MD, Brookes Publishing; 2007.
- British Columbia Association for Speech Language Pathology and Audiology (BCASLPA). What is evidence-based practice? Available at: http://www.bcaslpa.ca/professional/continuing-education/evidence-based-practice/.
- Abrams HB, Kihm J. An introduction to MarkeTrak IX: A new baseline for the hearing aid market. Hear Rev 2015;22(6):16. Available at: http://www.hearingreview.com/2015/05/introduction-marketrak-ix-new-baseline-hearing-aid-market.
DISCLAIMER
This study was organized by Widex Canada. Participants were not paid for their participation. Subjects had the option to purchase the hearing aids following the study at a discounted rate. The discount was not presented to them until following the study. Ryan Kalef is a Western Canada audiologist and account manager working for Widex Canada. Contact at r.kalef@widexcanada.com for more information.