The Quest for Audiometric Zero
Used with permission. From: http://www.hearingreview.com/2019/06/quest-audiometric-zero/
As with most sciences, there are some notable quirks in audiology, and the zero decibel point on the audiometer is one of them. Here is a brief history of the evolution of audiometric zero, the conflicting studies and controversies surrounding it, and how “0 dB” on the audiometer was ultimately established and standardized.
What is “0 dB” on the audiometer and how was it standardized?
I once asked a physician friend “What is average normal blood pressure?” “First of all,” he replied, “blood pressure is not a number; it is a range. If your number is in that range, relax! Otherwise obsessing about where it is within that range will only drive your blood pressure up!”
That is characteristic of most measures of bodily function, a range—not a number. And that is the way it would have been for hearing if the renowned physicist, Harvey Fletcher, had had his way. In the early days of audiometry during the 1920s his measured auditory thresholds were all expressed as sound pressure levels (SPL) relative to a defined physical reference level of 0.0002 dynes/square centimeter. All actual thresholds of listeners were expressed in decibels relative to this measure.
But this straightforward method of displaying audiometric data did not prevail. Early in the 1920s a distinguished otolaryngologist, Edmund Prince Fowler, seeking a method for expressing hearing loss as a percentage, proposed an audiometric format in which the actual average threshold SPL was defined as 100% of “average normal hearing” at each test frequency.This later became 0 dB sensation units, and eventually 0 dB hearing threshold level (HTL).
However, this is a number whose corresponding sound pressure level varies with frequency. What we now call “0 dB HTL” is linked to a series of SPL numbers that change as frequency changes. The various iterations of what those numbers should be is the complicated story of the quest for audiometric zero.
The American Standard
Throughout the 1920s and well into the 1930s, clinicians had to calibrate their own audiometers by testing a small number of people without hearing complaint, averaging those data, and noting what the correction on their hearing loss dial should be at each test frequency. The problem was worldwide. Users of audiometers complained to the manufacturers that 0 dB on the hearing loss dial ought to hold for all test frequencies. No problem said the manufacturers. Just tell us what the different SPLs should be at the different frequencies and we will insert appropriate resistors at each frequency.
Unfortunately, no one knew what the average SPLs at each test frequency should be, because no single individual could hope to gather and survey the large group of listeners necessary to calculate useful averages. Plus, in any event, whose numbers should the manufacturers adopt?
At this impasse the United States Public Health Service (USPHS) stepped in, determined to survey the hearing of citizens nationwide, in order to supply the necessary average SPLs at each test frequency. In 1935, the USPHS commissioned a young epidemiologist, Willis Beasley, to design and carry out a national survey of the SPLs corresponding to the average thresholds of large samples of the entire normal-hearing population of the country (Figure 1).

Figure 1. The“Beasley Survey.”
Beasley did an excellent job. Large samples were stratified geographically, crews were assembled and trained in the use of the audiometer, then sent out to key locations nationwide. Results were collated, analyzed, and made available to audiometer manufacturers in the United States. This study has since become known as the USPHS Survey of 1935–36, the “American Survey,” or simply the “Beasley Survey.”These data became the basis for what then came to be called the “American Standard” for audiometer calibration (Figure 2).
I had the pleasure of meeting Willis Beasley in the early 1960s in Houston. I was at the Baylor College of Medicine at the time, and he was working on a project at the University of Texas Health Science Center in a nearby building. We had a very pleasant chat in which he revealed that he went into his survey knowing a good deal about epidemiological surveys but not so much about testing hearing.

Figure 2. The American Standard
Parenthetically, I was working at the time on a study comparing the audiograms of Houston firemen of various ethnic origins. I asked Beasley what advice he could give me on how to categorize ethnicity in reporting such data. “Easy,” he replied. “White, black, and other.” I am sure that he would be astonished to learn how complicated that issue has become.
The Plot Thickens
After the conclusion of World War II, and inspired by the Beasley Survey, hearing specialists in the United Kingdom (UK) decided to carry out their own survey. They had expected to confirm the results of the Beasley Survey, but were surprised to find that their data showed better sensitivity by about 10 dB across the frequency range.
Confusion now reigned until scientists in Japan decided to carry out their own study, as well. The results of the Japanese survey agreed closely with the UK results—about 10 db better than the American averages. (Figure 3).

Figure 3. The UK and Japan Survey.
This seemed to be strong evidence that the American Standard was somehow flawed. At first it seemed that the best answer was differences in calibration of the test instruments for transferring the field data to SPL measured in an earphone coupler. But no explanatory errors could be found in the procedures, instrumentation, or data of any of the three surveys.
In an attempt to finally resolve the mystery, an American otolaryngologist, Aram Glorig, organized a new survey of American listeners (Figure 4). His team tested 3,500 people attending the 1954 Wisconsin State Fair in Wauwatosa, Wis. Glorig went to great lengths to duplicate exactly the procedures followed by Beasley’s teams in the 1935-36 survey. He wanted to leave no stone unturned in an effort to understand the discrepancies among the results from the three countries. His data confirmed the original Beasley survey data exactly.

Figure 4. Aram Glorig’s 1954 Survey.
Had the challenge to the American results been resolved? No, because the troubling 10 dB difference with the UK and Japanese data remained unexplained.
…And Why Is the Audiogram Upside-Down?
The quest for audiometric zero is not the only oddity in the evolution of audiometric standards. Another is the audiogram itself, and also involves two audiology legends previously mentioned in this article. At first glance, the audiogram is upside-down; the values on the vertical axis become smaller, rather than larger, as they move from the bottom to the top of the graph. How this anomaly came about is the story of an interesting collaboration among Edmund Prince Fowler, Harvey Fletcher, and R.L. Wegel. In the 1920s, both Fowler and Fletcher had proposed two alternative ways for recording audiometric threshold data—either of which probably would have been better than the present system, and would have preserved scientific tradition relative to the ordinates of graphs. To read more about the evolution of the audiogram, read Dr Jerger’s article, “Why the Audiogram Is Upside-down” in the April 2013 Hearing Review, or visit: https://bit.ly/2W7bdjq

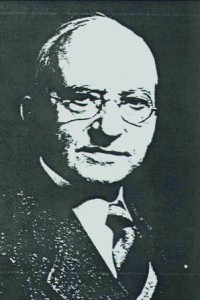
Edmund Prince Fowler (1872–1966) was a giant in otology during the first half of the 20th century and is perhaps best known for his discovery of loudness recruitment.

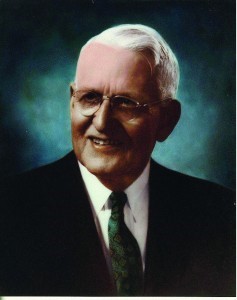
Harvey Fletcher (1884–1981) was a physicist who joined Bell Laboratories and became a pioneer in speech and hearing sciences.
Glorig thought long and hard about how such a discrepancy could have arisen. Since he had duplicated Beasley’s testing procedures exactly, that could not be the problem—or could it? The greatest difference that he could discern among the three surveys was that the Beasley survey had occurred before WWII, when audiometry was still a relatively new activity, and the other two, the UK and the Japanese surveys, after WWII. That, thought Glorig, was possibly a significant difference, perhaps reflecting the fact that experiences at the American Aural Rehabilitation Centers during and after the war resulted in improved testing techniques relative to the technique used by Beasley’s people.
Could the simple fact of more experience in audiometric testing during and after the war, in both the UK and Japanese surveys, explain the difference? Was it a mistake in the Glorig 1954 survey to duplicate carefully the procedure followed by Beasley’s teams? Or should they have used the newer laboratory techniques acquired from all of the testing during and after WWII.
So, in 1955, Glorig went back to the Wisconsin State Fair and repeated the 1954 survey, but this time instructing his team to follow the audiometric threshold-seeking procedures advocated in the classic 1944 Hughson-Westlake paper, by then renamed “laboratory methodology” (Figure 5). This time Glorig’s results improved by about 10 dB compared to his 1954 results, placing them in agreement with the UK and Japanese data. There now seemed to be overwhelming evidence that the American Standard needed to be revised by 10 dB.

Figure 5. Aram Glorig’s 1955 Survey.
Problem Solved?
Not quite! This whole affair had now become an international issue. In 1964, the International Organization for Standardization (ISO) met in Rapallo, Italy, to hammer out a new international standard (frankly based on the UK and Japanese data). It was known as the ISO-64 Standard, and was intended to replace the American Standard which had been serving as the de facto International Standard (Figure 6).

Figure 6. The ISO-64 Standard.
At this point a new organization entered the arena, the American Standards Association (ASA), newly renamed the American National Standards Institute (ANSI). They made a few minor adjustments to the ISO-64 Standard based on the Glorig 1955 data, then published in 1969 a new American Standard (ANSI-69) (Figure 7).
The latest version of this standard, S3.6 2018, retains essentially the same threshold SPL values as the 1969 version. It is identical to the latest ISO standard, assuring international standardization of audiometer calibration.

Figure 7. The ANSI-69 Standard.
Conclusion
Well, that is the complicated story of the quest for audiometric zero. The whole system is now so deeply entrenched that there is no possible way to turn back.
But still, wouldn’t it be elegant if auditory thresholds were referenced to the same SPL scale as hearing aid performance data—a system akin to that first conceived in the 1920s by Harvey Fletcher?
Acknowledgments
Many thanks to Laura Wilber and Susan Jerger for their helpful suggestions.
Correspondence can be directed to HR or Dr Jerger at: jjerger@utdallas.edu
Citation for this article: Jerger J. The quest for audiometric zero. Hearing Review. 2019;26(7):22-24.

