Other People’s Ideas
Calvin Staples, MSc, will be selecting some of the more interesting blogs from HearingHealthMatters.org which now has almost a half a million hits each month. This blog is the most well read and best respected in the hearing health care industry and Calvin will make a regular selection of some of the best entries for his column, Other People’s Ideas.
The sale of hearing aids contributes significantly to the bottom line in the business of audiology. I had a patient last week ask me why I should get a hearing test from an audiologist who is selling me a hearing aid. She went on to say, it doesn't sit well with her that the person determining my need for a hearing aid also sells me the hearing aid. The question asked was a first for me. Of course, I went through all the usual reassurance statements, but her question left me wondering what is happening with audiology, what is the public perception of hearing health care and what are the steps we need to take to ensure audiologists are still perceived as leaders in hearing health care. The readings below do not directly address my questions, but are aimed at promoting some discussion about how our industry is changing.
Costco Growth – Get Your Hot Dogs and Hearing Aids Here!
Originally posted at HHTM on April 4, 2017. Reprinted with permission
Costco growth has always been spectacular since its inception as a single warehouse in Seattle in 1983. Starting from scratch, Costco was the first company to grow sales to $3B in less than six years. By 2015, it ranked #2 in global retailing, just behind Walmart.
The Big Box That Always Thinks Outside the Box
Costco’s success is formulaic and time-tested. A limited selection of low-priced items, ranging from bulk (e.g., toilet paper) to luxury (e.g., diamond rings and watches), are offered in membership-only warehouses which themselves seem to reproduce as fast as bunnies (Fig 1). Item selection is far from static — new lines of business come and a few go (e.g., Costco Home). Hearing aids are a business that came and stayed.

Figure 1. Costco Wholesale warehouse locations in US and Canada as of 12/31/2016, per Costco Annual Report.
Hot Dogs and Hearing Aids
Hearing aids were introduced as a luxury item when Costco merged with Price Club in 1993/4. Keeping with its egalitarian success formula, Costco tossed hearing aids into its “ancillary business sales” section, right alongside hot dogs and gasoline.1
“Hot Dogs and Hearing Aids” isn’t a slogan or natural marketing approach for most, or maybe any, audiologists. Too bad for us. By 2004, Costco’s Annual Report was able to boast of:
“…our giant Kosher dogs regularly being named ‘Best Hot Dog’ in local competitions across the country. And our …Hearing Aid centers … showed double-digit gains last year.”
Double-digit gains were, and remain, the result of the low-price formula, which Costco customers expect for hearing aids as well as hot dogs. The Costco 2003 Annual Report noted that “…ancillary business sales … increase(d) 20% over fiscal 2002…. Our members like to shop Costco for …hearing aid(s)… because they know we offer the best quality at the best price…”.
And the rest is history, as Costco’s cryptic annual reports2, let on once in awhile:
- 2007: “…ancillary businesses…increased sales by more than 9% in fiscal 2007 to nearly $9bil.”
- 2011: “ancillary businesses…showed a sales increase of 24 percent in 2011.”
- 2012: “Costco’s low prices on both brand-name and generic prescriptions are well-known, and we have gained our members’ trust for their healthcare needs. Such a relationship is invaluable when it comes to health-related services, and we have extended that trust into our optical and hearing aid businesses as well. Sales in our 469 hearing aid centers exceeded $200 million in 2012, an increase of 22 percent from the previous year.”
- 2013: “Costco Hearing Aid Centers…increased profitability at a higher rate than the rate of sales increase. Such results were aided by the newest version of our highly rated, top-of-the-line Kirkland Signature digital hearing aids.”
- 2014: “Warehouse ancillary … gross margin when expressed as a percentage of net sales increased by six basis points, predominately in our optical and hearing aid businesses.”
- 2015: “Costco’s ancillary businesses (hearing aid centers) all performed well… Sales increased in all these operations”
- 2016: “…ancillary businesses … are all key components of our warehouses. (They) produced strong sales and profits performance in 2016 and helped drive incremental sales throughout the warehouse. We include …ancillary offerings in new warehouse openings, whenever possible; as well as add these operations to existing locations, as part of planned remodels and relocations.”
Do Hearing Aids Drive Hot Dog Sales?
It would seem so, based on the 2012 and 2016 quotes above. Costco uses hearing aids and eye-glasses to get members to make a warehouse trip to fulfill their healthcare needs. And why not get the shopping done and have a couple hot dogs while they’re there? The double-digit annual revenue growth in ancillary services and the ripple effect to sales of other products raises several points:
- Weight gain? Hearing aids are a form of healthcare but a possible unhealthy link may exist between hearing aids and hot dog -induced weight gain. Whether this adverse effect exists cannot be substantiated at present due to lack of available data.
- Profitability. Double-digit revenue growth with low margins proves that store-in-store healthcare is a good line of business for Costco.
- Access: Burgeoning sales growth deflates the claim in public policy discussions that access to hearing healthcare is limited. Access is only a problem for those few who don’t have a Costco card or live in Wyoming3 (see Fig 1).
A New Distribution Channel
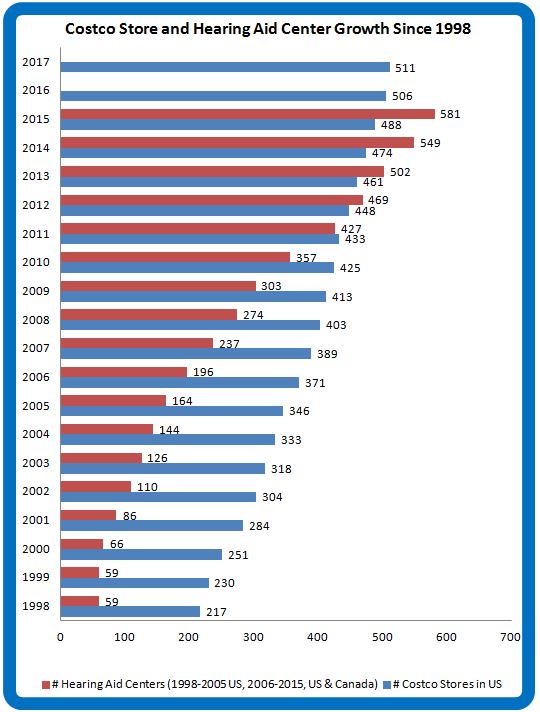
Figure 2. Annual growth of US Costco warehouses (blue) and Costco Hearing Aid Centers in US and Canada. (data from Costco Warehouse Annual Reports)
Thanks to store-in-store hearing aid center distribution, the problem of access to hearing aids diminishes with every year that goes by. In the beginning, Costco hearing aid centers were few and far between. Once the revenue and profit-driving force became evident, they became ubiquitous (Fig 2).
As fast as Costco warehouses have multiplied, Costco Hearing Aid Centers have multiplied faster. It’s reminiscent of the old quip about the Starbucks location in the bathroom of a Starbucks (which hopefully is apocryphal).
And sales have kept up with infrastructure, too. In January of 2015, Hearing Review reported five years of 20% year-over-year growth of Costco hearing aid sales. With all that profitability, investment in infrastructure, and specialized employee training to fit a healthcare product, it makes you wonder what Costco’s thoughts are on over-the-counter instruments.
Tune in again for the next Costco installment, when we consider whether Costco’s growth of market share signals a growth of the market itself or just a loss of share for other providers.
Footnotes and References
1Pharmacy; optical dispensing centers; one-hour photo; food court and hot dog stands; hearing aid centers; copy centers; print shops; and gas stations comprise Costco’s ancillary business division.
2Most Costco Wholesale Annual Reports can be found by clicking here and downloading the desired pdf. Early reports are harder to find but most exist and can be found with the right Internet search terms.
3Wyoming is interesting and we’ll get back to it in a future post.
Boyle M. Why Costco is so addictive. Fortune Magazine, Oct 25 2006.
Costco’s Business Model: Build It and They Will Come
Originally posted at HHTM on April 12, 2017. Reprinted with permission
Costco has enthusiastically embraced hearing aids as store-in-store revenue builders in all of its burgeoning warehouse locations since the mid-90s. The rate of Costco hearing aid center growth (feature image, red) has outstripped warehouse growth (blue) in recent years. Both are on fast tracks.
Last Giant Standing, Building-Wise

Figure 1. Proliferating big Boxes and booths-in-boxes. Costco locations as of 12/31/2016.
Costco’s Big Box footprint is large on the land (Fig 1). There’s a booth in every Box. Hearing aid prices are low, revenues are high. Those facts are established.
Other economic facts are harder to come by; some are still emerging. On its own, the building-and-booth growth strategy does not automatically conjure increased consumer demand for hearing aids and services. Spikes in consumption do not automatically translate to increased satisfaction and shifts in Demand.
Big store retail chains of all varieties are failing or drastically reducing their infrastructures (think Sears, JC Penney, Radio Shack, Macys, WalMart, Kmart, Kohl’s, Safeway, Staples), due to changing shopping patterns (think Amazon and probably drones). This year is expected to bring a “giant wave” of closings in the US to reduce the square feet of retail space per person, which is the highest in the world (23.5 sq ft per capita).
In the middle of this, Costco is building more boxes and booths-in-boxes? Is it possible that hearing aids are the last frontier on in-store retail? Are they a serious part of the Costco expansion strategy? Inquiring minds wish to nail down Costco’s share of the hearing aid market and know in what ways its presence is influencing the goods market and sending shocks to the supply side.
The last post left hanging the question of whether Costco’s growth of market share signals a growth of the market itself or just a loss of share for other providers. Today’s post takes a swag at an answer.
Costco Market Share
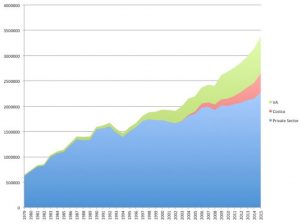
Figure 2. US hearing aid sales growth for private practices, Costco and VA. (from Hearing Review treatment of HIA data)
Costco sales have indeed kept pace with its infrastructure expansion, at times at the expense of existing practitioners. In 2014, 1.9% of private sector growth (3.4% total) was attributed to Costco. One can interpret this to mean that the traditional 3-4% expected annual growth at retail held steady that year, but only because Costco took market share from dwindling private practice sales. Those grew a paltry 1.5%.
Everybody did better in 2015 (Fig 2). Private sector sales grew by 7.83%, racking up $2.65M sales. Hearing Review pegged Costco’s market share at 11% and noted 20-25% year-over-year growth for 2015 and the previous five years.
One could interpret 2015 to mean that the pie was growing, thanks to all involved. Rather than posing a threat to private practices, perhaps Costco was doing its share to grow the pie and spread the wealth. Or maybe not. What if it’s growing the pie but wants more pie?
Eat More Pie!
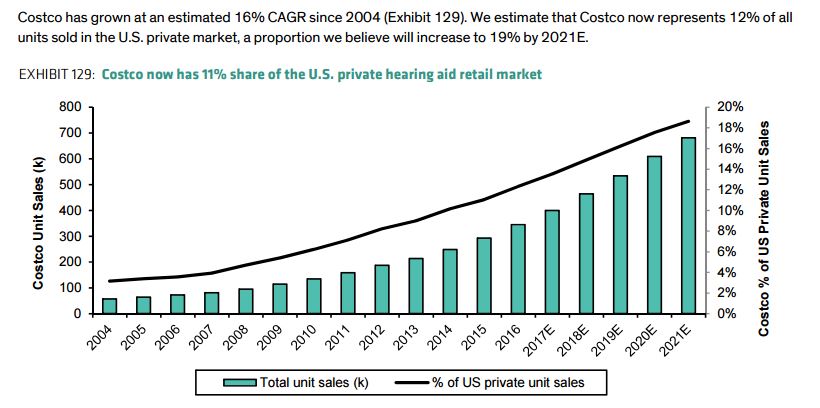
Figure 3. Estimated and forecast Costco market share of US retail hearing aid market. Reprinted with permission from Clive LB et al, Bernstein & Co, 2017.
Financial analysts peg Costco’s current market share at 11-12% of US commercial sales and rising (Fig 3). To put that in bottom-line perspective, 11-12% translates to about 322,000-350,000 units sold by Costco in 2016. That in turn drills down to 600-700 aids/store (assuming all 506 US stores have hearing aid centers), or monthly sales in the mid 50’s (53-58 aids/month) for every single store in the US. Wow. It is no wonder that one insider reports being “…told on more than one occasion, that
on a square foot basis the Hearing Aid business is by far the most valuable real estate in the warehouse.”
The overall commercial US hearing market grew at a healthy pace in 2016 — 10.6%, which beats the almost 9% growth of 2015. Hearing Review estimated 15% internal growth in sales at Costco. On that basis, HR assigned Costco 12% of the market in 2016. Running the numbers, Costco alone accounted for almost 1% of total 2016 retail growth.
More pie for all, but Costco’s slice keeps getting bigger.
A New Price Point
The hearing aid market, as we know it, is famous for low, static penetration and highly inelastic Price Elasticity of Demand. In such a market, it’s not unreasonable to wonder whether Costco itself is a Demand shifter and not just a market encroacher.
A prior Econ 101 post discussed the distinction of this important difference.
- Sliding up and down the Demand curve is what happens in a stable market: sales rise as Price falls (and vs).
- Shifting the Demand only happens when the market is “shocked”: sales rise for a determinant other than Price.
The US hearing aid market is shifting in a positive direction thanks to several economic determinants familiar to all of us in the profession. Baby Boomers are hitting 65 and the aging population in general is growing healthier and proportionally larger. Even without Costco, more hearing aids are bound to go out the door.
For these and other reasons1, financial analysts forecast future market growth in hearing aids. In addition, Costco is identified as another determinant shifting Demand, believed to be
“…expand(ing) the market by opening up a new price point.”
As Always, It’s Not (Just) About Price
The price point determinant is interesting and deserves data drilling in another post. Price, by itself, does not shift Demand. Price is an independent variable that slides consumption up and down a given Demand schedule. In the equation, there is a one Quantity demanded for a given Price. That may sound like an academic distinction (which it is), but it’s one of consequence.
Conversely, Price of a substitute (similar) good is a determinant that can shift Demand, meaning that Quantity demanded changes for a given Price. The more Costco hearing aids are perceived as similar to traditionally dispensed instruments, the closer the substitute and the more it is consumed, which shifts the overall hearing aid Demand curve “up.” If the Price of substitutes drop, the Price of the “other good” usually drops as well, with expected result: lower Price, more consumed. This effect is evident in recent times in the hearing aid market, too.
One other Demand shift determinant is change in consumer preference. In the present case, consumer preference is expressed in access as well as price. If consumers prefer lower price in combination with a non-medical, store-in-store dispensing model, this too will shift the hearing aid Demand curve out.
Costco’s success may be more significant than just taking market share from existing providers by putting pressure on Price. Instead, it’s success (or audiologists’ failure) may be due to a new, frequently-preferred distribution channel for a substitute good which is undifferentiated from traditionally dispensed hearing aids in the minds and wallets of a growing group of consumers.
One way to test that idea is to look at market growth in states with lots of Costcos versus states without Costcos (yes, there are a few still out there). Look for a rudimentary analysis along these lines in a future post.
References & Footnotes
Clive LB, Wielechowski R & Morse A. EU Medtech (Re-Initiation): Fix the Cost Problem, Don’t Cause It. Bernstein & Co. March 2017.
1In addition to Costco’s low price point, other reasons for expected market growth are: 1) retail marketing to draw in more and younger consumers, 2) aging baby boomers, 3) destigmatization due to technological advances and entry of “non-specialty” retailers. (from Bernstein report)
How Do Audiology Services Add Value?
Originally posted at HHTM on April 11, 2017. Reprinted with permission
Harvey Abrams comes through again in a recent posting on this site entitled "Noise in the Quiet”. Dr. Abrams discusses the value that audiology can add to the patient with the clinical methods we should possess. He states:
Note that I purposely avoided the word “bundling” here because bundling is often associated with a false choice – either you charge one fee for everything or you charge a separate fee for everything. There are many ways to separate the product from our services -we are limited only by our imagination.
However, in a recent post to the American Academy of Audiology’s General Audiology Digest, Dr. Roy Sullivan warns us:
“Value-added in not an assertion, it is a perception!” The “unbundlers” in our field sorely ignore this harsh truth. One cannot justify costs of services detached from cost of product by simply invoking a litany of what you, as dispensing audiologist, promise to provide beyond product. It is the patient’s perception of your intrinsic value-added that drives success or failure of the ensuing clinical encounter and enterprise.
Dr. Abrams provides a list of clinical activities that provide value to the patient. And he concludes that
The perceived value of these procedures seems to have been lost on the PCAST, the press, and the public…. But it’s not going to be enough to simply list the professional services we provide in answer to the question, “why do hearing aids cost so much.”
How is Value Added to Audiology?
How is value added to audiologic procedures? Let’s take a closer look, as there is a need to add to Dr. Abrams’ comments.
- Patients should realize that services are associated with a cost. Bundled or unbundled, time, skills and expertise come at a price. And, in our haste to “get into the profit game” in the late seventies and early eighties, and because we used a model in which sellers and sales offices did not (could not) list clinical services, we didn’t either. It seems that we did not think far enough ahead to itemize.
- Third party payers must have a way to code the procedure prior to their paying for it. And, that procedure has to be demonstrably valuable to patient care. If what we do has value, we have to be able to prove it undeniably. Can’t we do that for most of what is done in out clinics? Don’t any of our associations have a list of rehabilitative services with justifying information available to their members? If not, shouldn’t they?
- While Medicare does not pay for hearing aids, if they passed a law that incorporated such payment into their schedules, wouldn’t it be a little too late to argue that we do it better than anyone else when there was no code history, no payment history, and no other evidence that we used any of these clinical tools? This lack would not be a “good duck” in our row.
- Third party billing history would seem to indicate that, when we had a new or better test, we billed under a generic code and added procedural notes (justifications) to that billing. After a while and enough submissions, payers put a new code into the manuals. This is how most procedures get into the system—insurers get tired to reading all that “proof” after a while, and then denying payment in the face of that justification.
- Insurers are more willing—not happy but more willing—to pay for diagnostic procedures if there are investigative procedures that help define the hearing loss more completely (demonstrated in peer-reviewed research). If these tests will facilitate treatment, these procedures should be used and billed to third parties with the “universal” code (justification will be required).
After you read Abram’s article, you will need to carefully review the recent study from Indiana University from Larry Humes and colleagues.
All audiologists need to incorporate these ideas and practices in their services. And then they can wage a reasonable and justifiable fight for reimbursement. Not in the manner they have been doing, but in the way it has worked in the past. Fee for service may be the salvation of the field.
References
Humes, L., Rogers, L., Quigley, T., Main, A., Kinney, D. & Herring, C. (2017). The Effects of Service-Delivery Model and Purchase Price on Hearing-Aid Outcomes in Older Adults: A Randomized Double-Blind Placebo-Controlled Clinical Trial. American Journal of Audiology, Retrieved March 7, 2017.
Treating the Cochlea, not the Audiogram: The Value of Good Audiology
Originally posted at HHTM on March 21, 2017. Reprinted with permission
“Signal & Noise” is a bimonthly column by Brian Taylor, AuD
Recall the term “good audiology” is loosely defined as a combination of science and art that cannot be duplicated by a computer algorithm. The first two Signal and Noise posts of 2017 were devoted to this concept of “good audiology” and why – even in this era of disruptive technology and service models – it is even more important than ever.
Speech Audiometry Resuscitated
This installment of Signal and Noise examines the limitations of the ubiquitous pure tone audiogram as a counseling tool and how the use of one quick speech audiometry procedure can provide important insights into hearing aid expectations and use. As you will recall from your introductory coursework in clinical audiology, speech audiometry – when properly conducted – is an effective way to evaluate the information carrying capacity of the cochlea and remaining auditory pathway.
The use of one additional low level speech test, described below, allows audiologists to resist the temptation to treat the audiogram, and instead treat the damaged cochlea.
Speech Performance-Intensity Functions
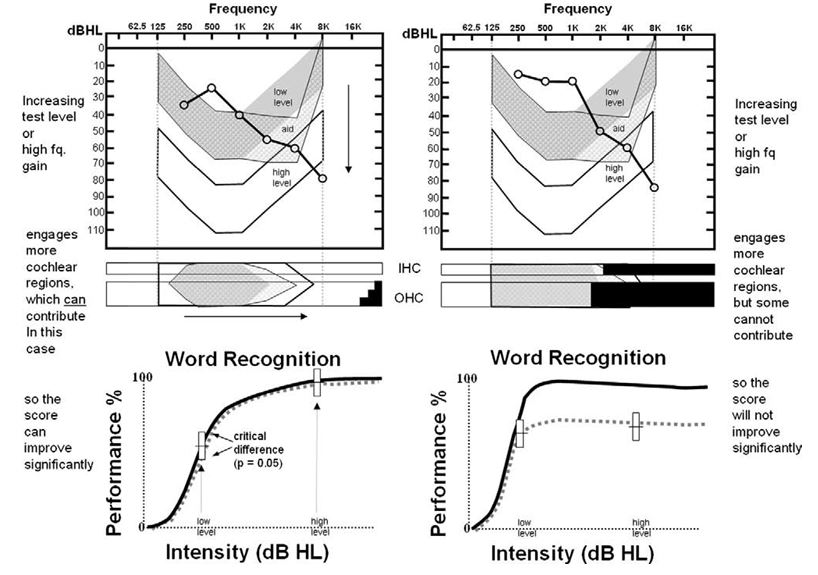
Figure 1. Audiogram, cytocochleograms and performance-intensity functions from two temporal bone cases. Described here as Patient A (left) and Patient B (right). From Halpin, C. & Rauch, S. (2009) Clinical implications of a damaged cochlea: Pure tone thresholds vs. information-carrying capacity. Otolaryngology-Head & Neck Surgery. 140, 473-476.
Conducting routine speech audiometry at two intensity levels can be a particularly effective way to explain hearing aid performance differences, especially in patients with mild to moderate, downward sloping hearing loss. This is illustrated in the Figure 1, which was reported by Halpin and Rauch in 2009 (p.474). Notice in the Figure two similar audiograms from two different patients: call them Patient A on the left and Patient B on the right.
If the clinician were to rely on standard tests – the audiogram and speech testing completed at higher intensity levels only, both patients are likely to be fitted and counseled in very similar ways. However, by conducting word recognition at a low and then high intensity level, the potential information carrying limitations of the cochlea can be established in a way that is easy to communicate to patients.
Specifically, note the results for Patient B on the right side of Figure 1. These results, shown on the bottom right performance-intensity function, indicate the information carrying capacity for this patient is severely limited – increasing the intensity of the speech does not result in an improvement in word recognition ability. It is this limitation that cannot be overcome with gain from hearing aids.
Using Speech Performance-Intensity Functions to Predict Hearing Aid Benefit
Most clinicians conduct speech audiometry at higher levels (see Guthrie & Mackersie, 2009 for details on best practices) as part of a routine diagnostic assessment. But as Halpin and Rauch point out, by adding a low level presentation, the clinician can demonstrate to the patient the potential for improvement from the gain provided by amplification. In their paper, they suggest conducting the procedure at two levels: 40dB HL and 70 dB HL. You could also obtain similar information by using any validated speech test, like the Quick SIN, by presenting a list at a low level and comparing it to the score you obtain at a higher intensity level.
Further, if you are wondering of it is really worth the time to make one more run of 50 words in each ear at a lower intensity level, the authors reported that of 255 cases of individuals with sloping audiograms, like the ones shown in Figure 1, a whopping 81% of cases showed no improvement at the higher intensity level.
These patients need to know that hearing aids (or any other device that restores audibility) won’t exceed their scores obtained at the higher intensity level obtained with earphones. There is a performance ceiling, uncovered by their performance-intensity function.
The bottom of Figure 1 shows the performance-intensity (PI) function for both Patient A (bottom left) and Patient B (bottom right). Note the normal PI function is in bold, while the results for both patients are represented by the dotted line. The results on the bottom left, which shows a tight match of the normal PI function, indicate the Patient A should perform quite well with hearing aids when audibility is optimized. On the other hand, as shown at the bottom right of the Figure, Patient B is likely to experience significant limitations from amplification even when audibility is optimized. Patient B will, in addition to gain, require technology that markedly improves signal to noise ratio, such as companion microphones or assistive listening devices.
Audiologists as Experts in a Time of Second Opinions
The report from Halpin & Rauch is another example of the need for “good audiology” — a clinician who can quickly and accurately conduct a validated test and use this information to make better decisions for patients. In the case of those 81% that show no improvement in performance at the higher intensity level, it is up to steadfast clinician to temper expectations, explore alternative technology that maximizes the signal-to noise ratio and not oversell the benefits of hearing aids.
As more and more patients purchase PSAPs, over-the-counter devices, and eventually, self-fitting hearing aids, it is likely clinicians will see some of these patients for a second opinion – patients that are likely to have similar performance-intensity curves like the one on the bottom right in the Figure below and are below par benefit than expected with their devices. The use of simple procedures, like presenting words at a low and a high level and plotting on the performance-intensity function, help position clinicians as experts, unbound from their hearing aid technology, willing to use data to make clear decisions for patients.
References
Guthrie LA & Mackersie CL. A comparison of presentation levels to maximize word recognition scores. J Am Acad Audiol. 2009 Jun;20(6):381-90.
Halpin C & Rauch SD. Clinical implications of a damaged cochlea: pure tone thresholds vs information-carrying capacity. Otolaryngol Head Neck Surg. 2009 Apr;140(4):473-6. doi: 10.1016/j.otohns.2008.12.021.

