Patient Satisfaction With Widex Moment™ Hearing Aids in Real-Life Listening Environments


INTRODUCTION
Widex has a strong history of providing the best, most natural sound quality to hearing aid users. Widex MOMENT™ was recently launched and represents Widex’s latest efforts in furthering this tradition. MOMENT introduced two new sound-related features : TruAcoustics and PureSound™. TruAcoustics increases the precision of gain delivery at the eardrum by assessing fitting variables (e.g. venting) in the individual ear and applying this information to the gain calculation. PureSound significantly reduces processing delay, thereby eliminating a major source of distortion that negatively affects sound quality in open and large-vented fittings.
Widex also has a strong tradition of assessing the real-world performance of their innovations (Balling et al., 2019; Kalef et al., 2016; Kalef et al., 2018, Spencer et al., 2019). Here we continue this tradition with the logic that if major technological advancements do not translate to real-world satisfaction, impact will be limited for the hearing aid user. With this in mind, the purpose of this investigation was to examine satisfaction with Widex MOMENT hearing aids in a variety of real-life listening situations.
METHODS
Data was collected in Canada as part of a global-scale survey conducted by Widex. This global survey involved 7 countries in total (Balling et al., 2021). This article reviews results obtained in Canada specifically.
Between June 2020 and Sept 2020, 29 participants from eight clinics across Canada were asked to evaluate the Widex MOMENT 440 mRIC R D (MRR2D 440) hearing aids and to compare them to their existing hearing aids. Specifically, participants were asked to complete subjective satisfaction surveys for each set of hearing aids based upon the MarkeTrak IX questionnaire.
PARTICIPATING CLINICS
Clinics across the country were selected to ensure a broad sample of participants and clinical practices. Participating clinics are listed in Figure 1.

PARTICIPANT INCLUSION CRITERIA
To provide results that can be applied to different common clinical situations, broad selection criteria were used. Participants were not excluded based upon type or configuration of hearing loss.
Twenty-nine participants took part in the survey: 14 females and 15 males. Mean age was 64.6 years. Breakdown of participants’ own hearing aid brands is shown in Table 1.
| Own Hearing aid Brand | # of Participants | Percentage (%) |
| Widex | 10 | 34.4 |
| Resound | 5 | 17.2 |
| Oticon | 4 | 13.8 |
| Unitron | 4 | 13.8 |
| Phonak | 5 | 17.2 |
| Bernafon | 1 | 3.4 |
| Total | 29 | 100 |
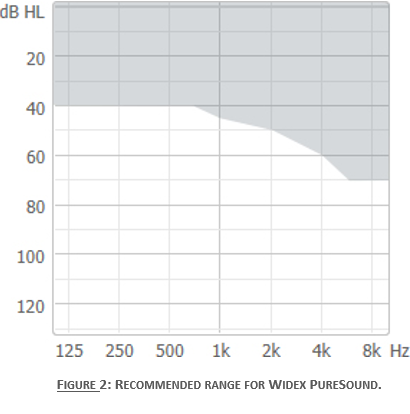
Participants were placed into one of two groups: a PureSound group or a Universal group. The PureSound group was made up of participants whose hearing loss fits entirely within the PureSound fitting range shown in Figure 2 in both ears. They were fitted with the PureSound program as their default. The Universal group was made up of participants whose hearing loss (in one or both ears) was beyond the PureSound fitting range but within the fitting range for the M-receiver (Figure 3). Hearing aids were programmed and fit using Widex’s proprietary fitting software (Compass GPS) and fitting targets.

PROCEDURE SUMMARY
Clinicians were given instructions to execute the study and were asked to fit the MRR2D 440 devices using the Widex Fitting Rationale available in the Compass GPS fitting software. All patients were assessed, fit, and counselled using best-practice procedures as deemed appropriate by the clinician. Real-ear verification was permitted but clinicians were asked to refrain from adjusting the devices to match generic fitting targets (eg. NAL-NL2) since assessing the Widex Fitting Rationale was of interest in the survey.
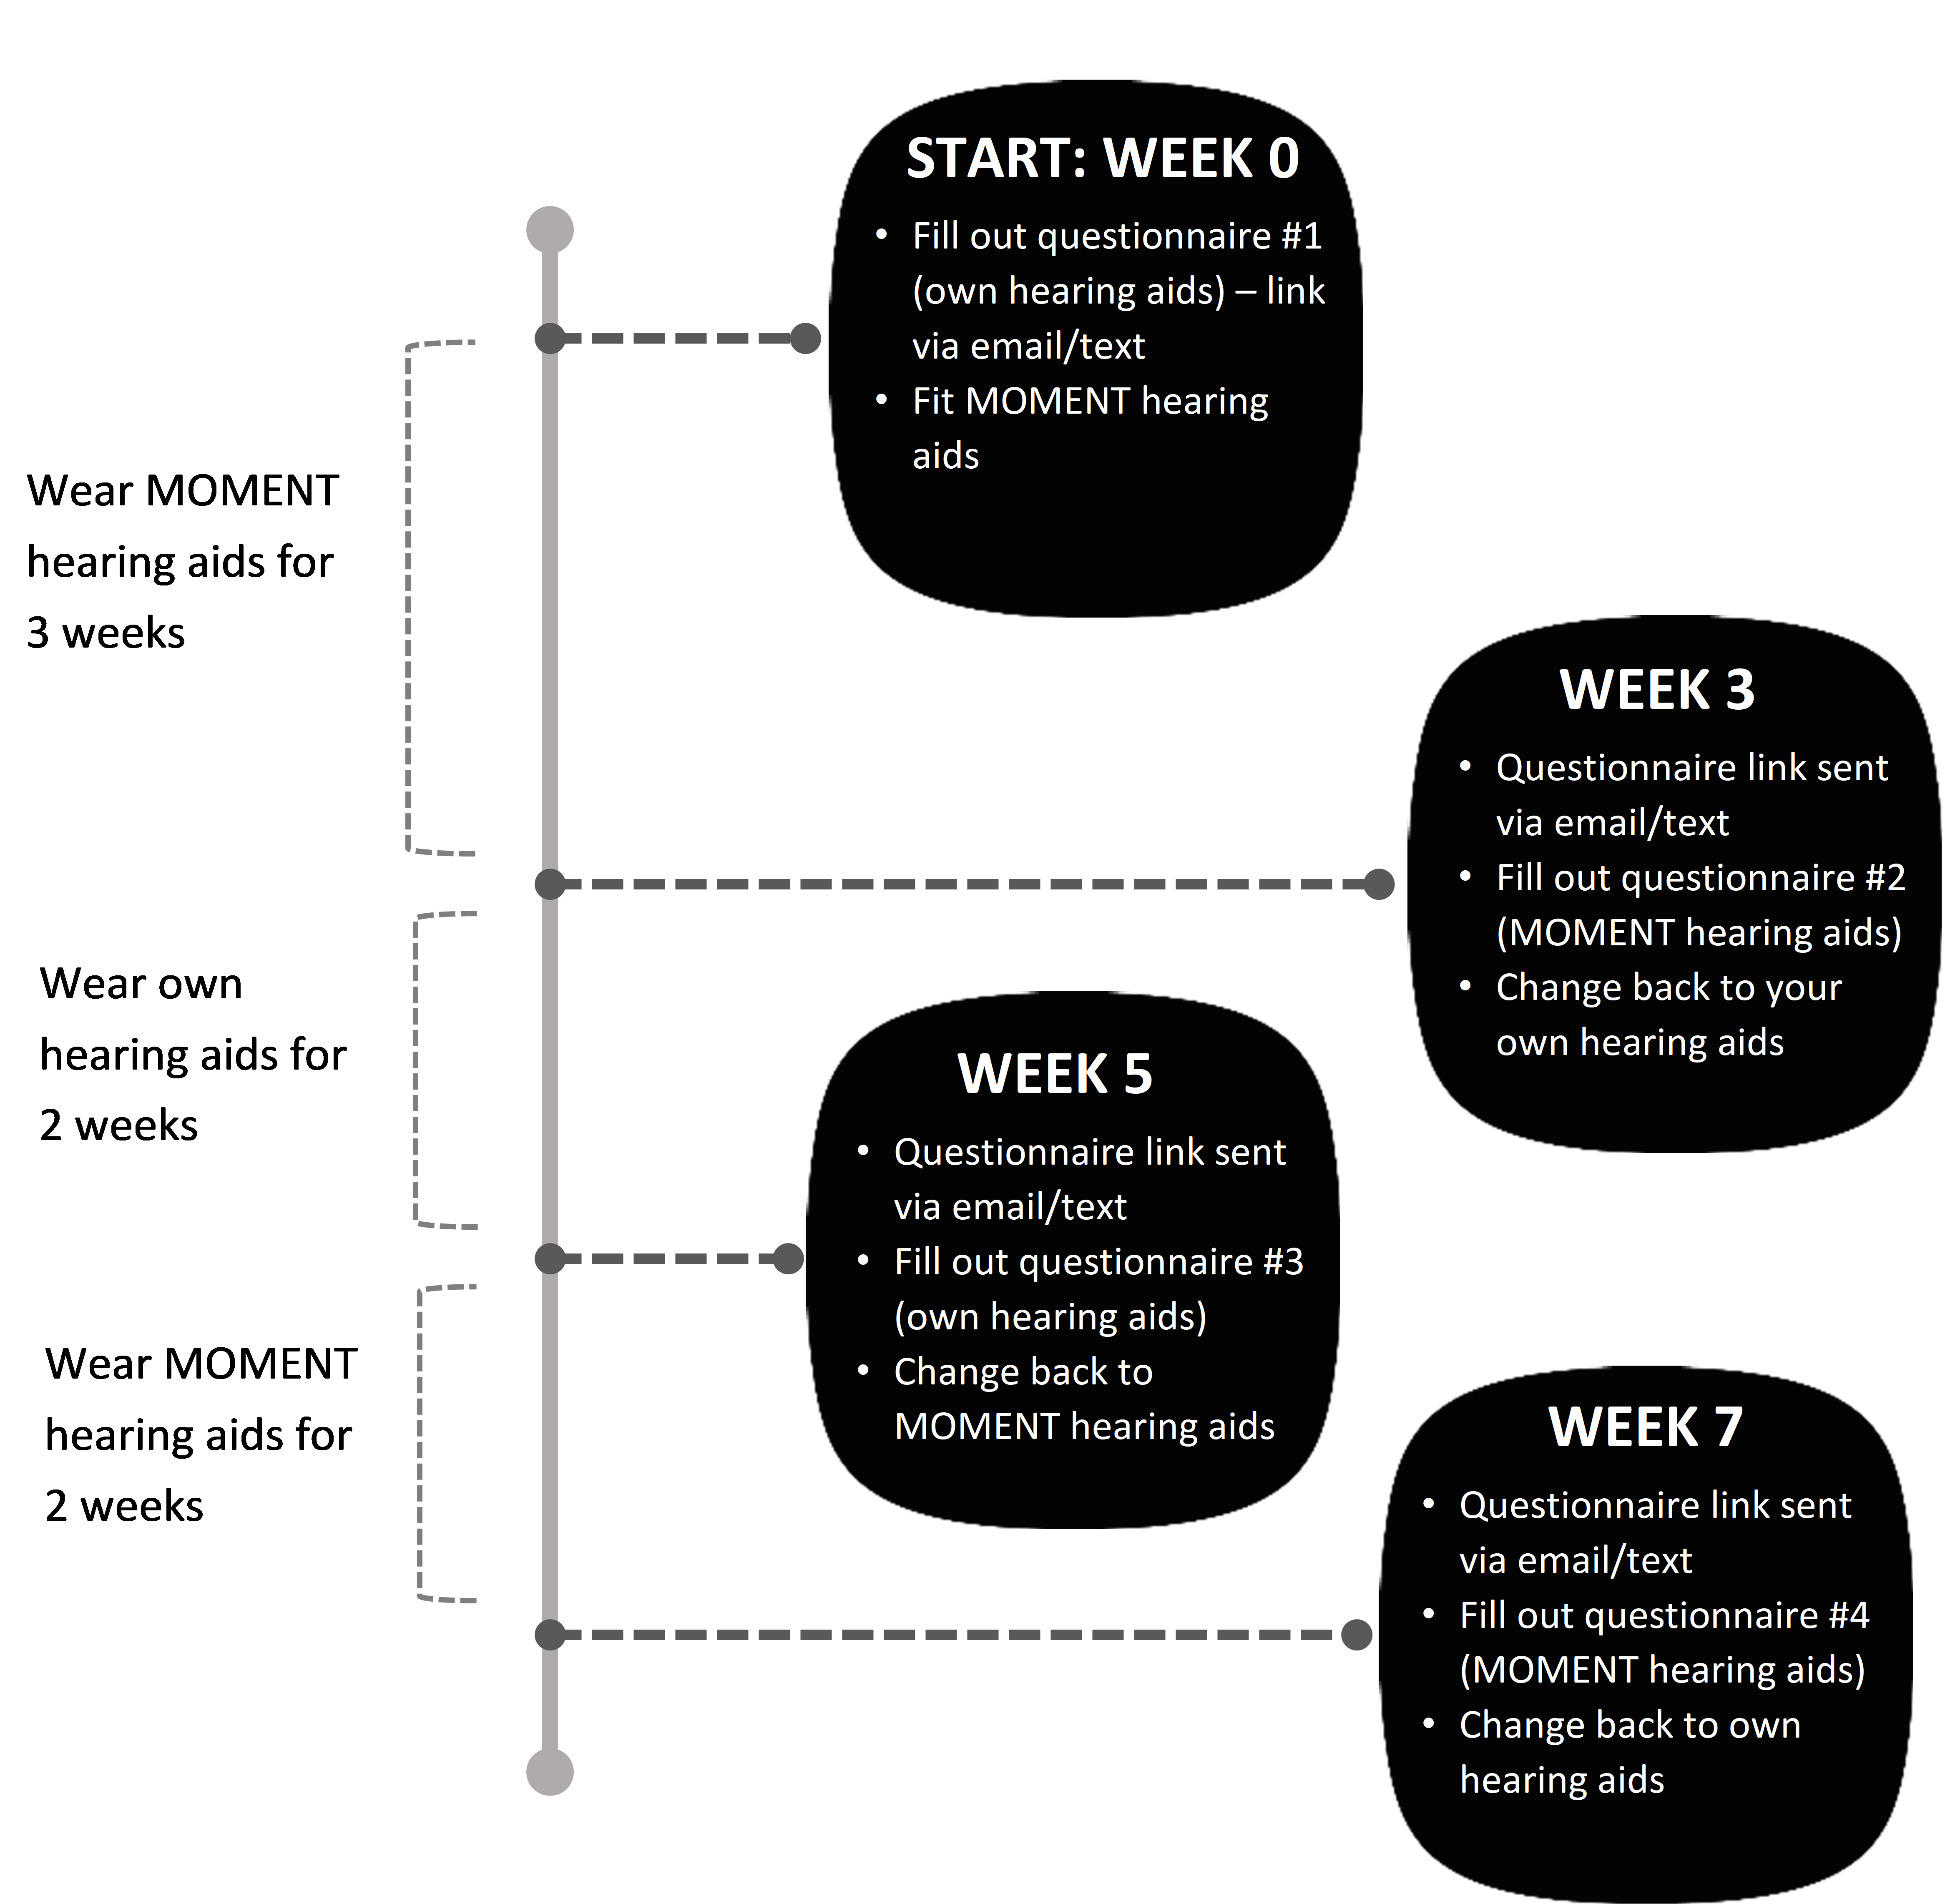
Participants compared the MRR2D hearing aids to their own hearing aids by completing online questionnaires that assessed specific aspects of hearing aid use as well as satisfaction in a variety of listening situations. The survey took 7 weeks to complete and employed a cross-over design (See Figure 4). This design gave patients the chance to assess each set of instruments twice, increasing the reliability of answers over a single comparison. Data presented here is based on comparisons of the week 5 and week 7 questionnaires (final assessment of each set of instruments). There was no reimbursement for the clinicians or patients.
The survey questions were based on the MarkeTrak survey questions and examined satisfaction with multiple hearing aid characteristics as well as satisfaction in various listening environments. All questionnaires were identical except for the week 3 and 7 questionnaires which contained some additional questions specific to the MOMENT devices. Ratings were provided on a 7-point scale that ranged from “Very dissatisfied” (assigned a value of 1) to “Very satisfied” (value of 7), with a rating of 4 being “neutral.” Statistical significance was calculated using the Wilcoxon Signed-Rank Test (p<0.05).
RESULTS
The MOMENT instruments were rated significantly higher (p< 0.05) than participants’ own hearing aids in a number of areas: overall satisfaction, sound quality, noisy backgrounds, audibility of soft sounds, conversations in noise, restaurants, TV, across different listening situations, music, naturalness, own voice, and clarity. In this article, we will focus on examining five key variables: Overall satisfaction, sound quality, and satisfaction during conversations in noise, while watching TV, and while listening to music.
Overall Satisfaction
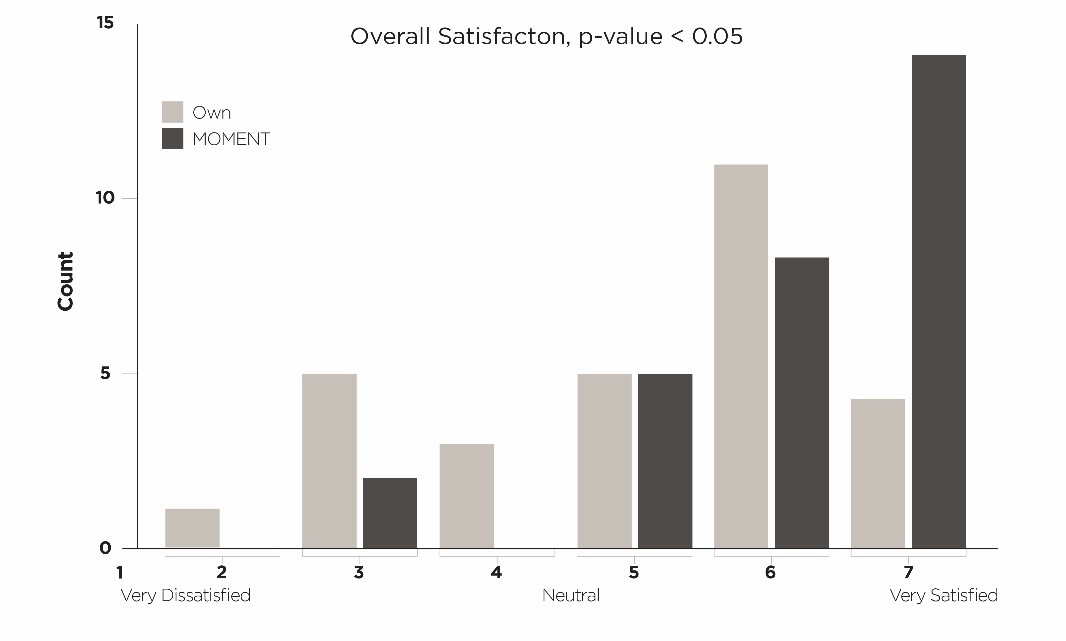
As Figure 5 shows, responses shifted to the right (higher ratings) when MOMENT was used as compared to participants’ own hearing aids. The mean shift per participant was 1.0, which is statistically significant. The largest difference was seen at the rating of “Very satisfied” where 10 more participants made this selection for MOMENT compared to their own instruments. Overall, participants showed a significant improvement in overall satisfaction with MOMENT.
Overall Sound Quality
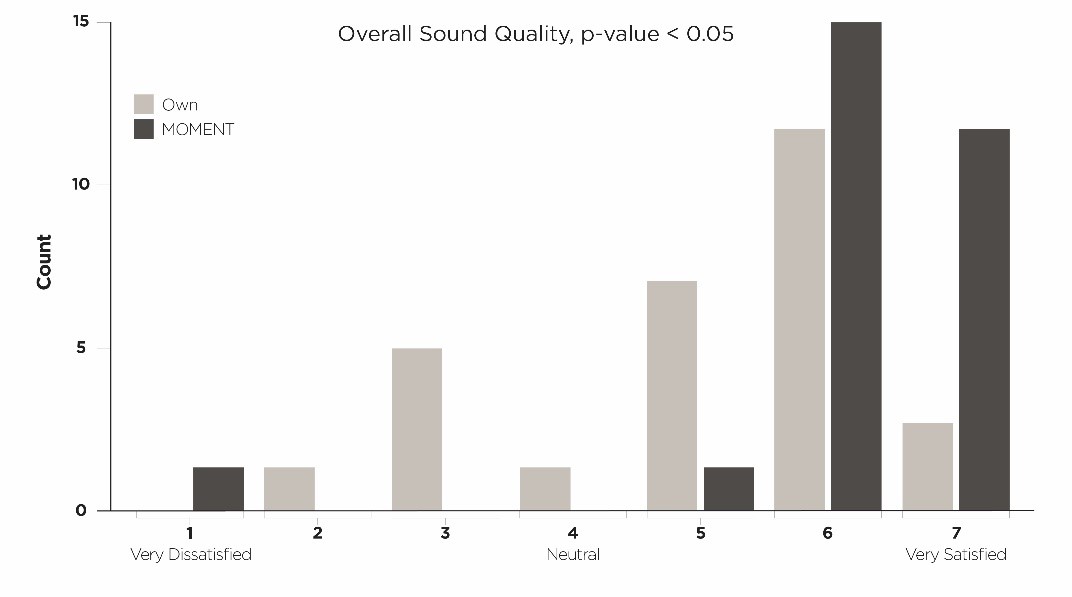
Overall sound quality, displayed in Figure 6, shows that responses again shifted to the right (higher ratings) when MOMENT was used as compared to participants’ own hearing aids. The mean shift per participant was 1.07, which is a statistically significant difference. The largest difference was seen at the rating of “very satisfied” where 9 more participants made this selection for MOMENT compared to their own instruments. In summary, there was a significant improvement in perceived sound quality with MOMENT.
Satisfaction in Key listening Situations
Here we will look at satisfaction in 3 specific listening situations: in conversations in noise, while watching TV, when listening to music. These specific situations are not only common amongst hearing aid users, but they are also where patients often report difficulties.
Figure 7 displays responses for conversations in noise. Again, responses shifted to the right (higher ratings) when MOMENT was compared to own hearing aids. The mean shift per participantwas 1.66 which was a statistically significant difference. The largest difference was seen for the rating of “satisfied” where 7 more participants made this selection for MOMENT compared to their own devices. In summary, we see significant improvements in satisfaction with conversations in noise with MOMENT.
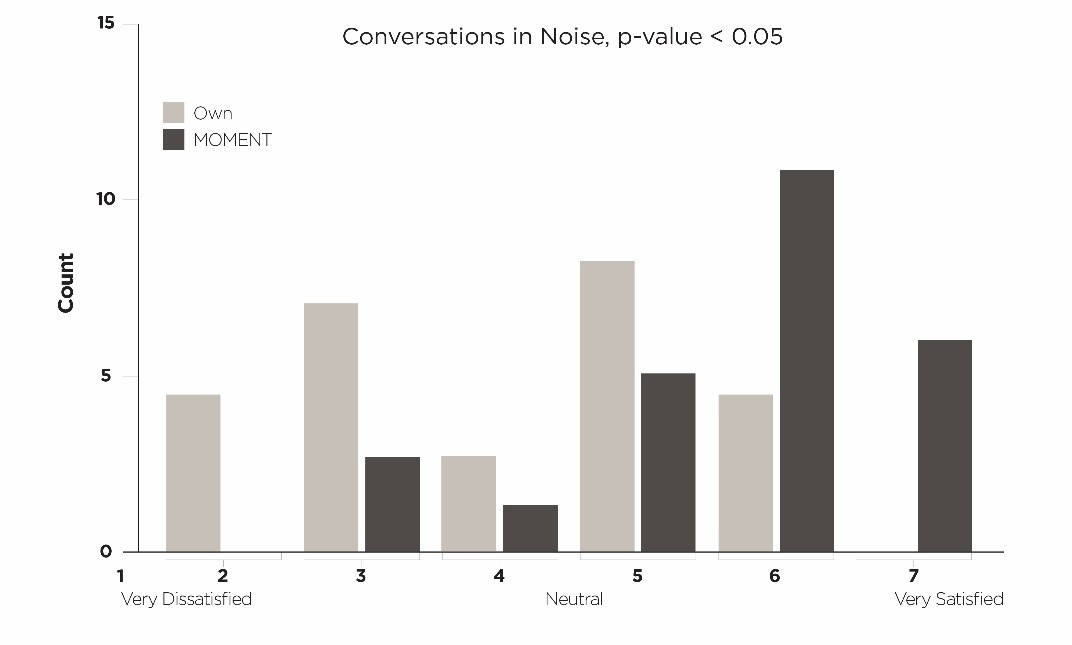
Figure 8 displays responses for satisfaction while watching TV. Again, responses shifted to the right (higher ratings) when MOMENT was compared to own hearing aids. The mean shift per participantwas 1.6 which was a statistically significant difference. The largest difference was seen for the rating of “satisfied” where 7 more participants made this selection for MOMENT compared to their own devices. In summary, we see significantly improved satisfaction while watching TV with MOMENT.
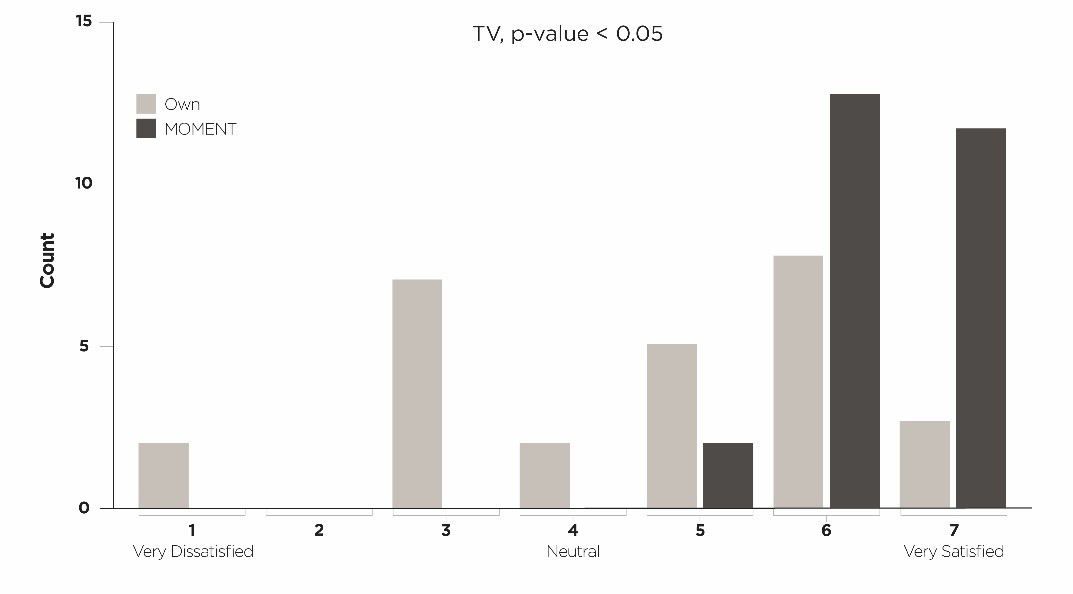
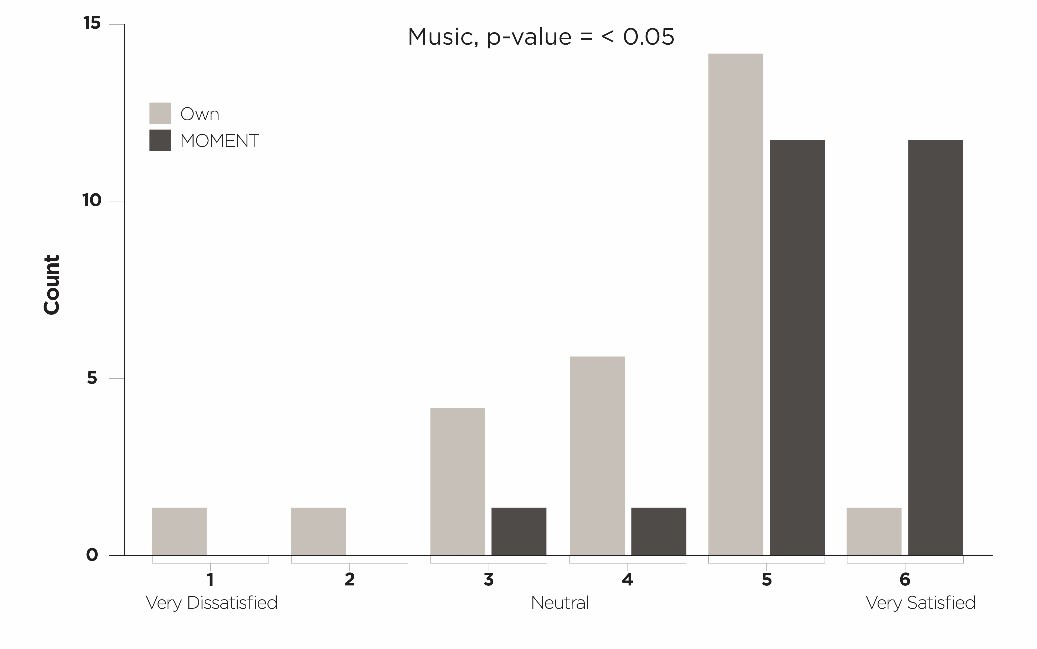
Figure 9 displays satisfaction ratings when listening to music. Again, responses shifted to the right (higher ratings) when MOMENT was used as compared to participants’ own hearing aids. The mean shift per participant was 1.07 which reached statistical significance. The largest difference was seen at the rating of “very satisfied” where 12 more participants made this selection for MOMENT compared to their own instruments. In summary, we see significant improvement of satisfaction when listening to music with MOMENT.
CONCLUSION
The drive for maximizing sound quality is justified based on evidence that sound quality characteristics are the main driver of overall satisfaction with hearing aids (Abrams & Kihm, 2015; Picou, 2020). Precise gain delivery at the eardum and the provision of transparent, distortion-free sound have been goals of Widex for many years since they contribute to overall sound quality. TruAcoustics and PureSound are designed to contribute to these goals and likely played a role in the overall finding that participants rated Widex MOMENT MRR2D 440 hearing aids higher compared to their own hearing aids.
The results provide clinicians with relevant evidence to support their clinical decision when prescribing MOMENT instruments. When recommending hearing aids for patients, the primary concern for most clinicians is that the new devices will produce a noticeable improvement in satisfaction in a variety of listening situations. The study design supports a direct application of its results to real-life clinical settings in Canada and provides evidence that satisfaction levels with MOMENT MRR2D 440 instruments are significantly higher than existing technologies on the market.
REFERENCES
- Abrams HB., Kihm J., (2015). An Introduction to MarkeTrak IX: A New Baseline for the Hearing Aid Market. The Hearing Review, 22(6):16.
- Balling, L., Townend, O., Switalski, W. (2019). Real-Life Hearing Aid Benefit with Widex EVOKE. The Hearing Review. January, 2019.
- Balling, L., Townend, O., Helmink, D., (2021). Sound Quality in Real-Life – Not Just for Experts. The Hearing Review. February, 2021.
- Kalef, R., Lau, C., Liu, R., McFadden, M., Sharpe, M. (2016). A Canadian Evaluation of Real-Life Satisfaction of Hearing Aids in Challenging Environments, Canadian Audiologist, 3 (5).
- Kalef, R., Adam, I., Davidson-Bertrand, J., Leutri, S., Levionnois, J., McFadden, M., Sorensen, N., Gent, S. (2018). Industry Research: A Canadian Evaluation of Real-Life Hearing Aids with Direct Connectivity. Canadian Audiologist, 5(6).
- M. Picou, (2020). MarkeTrak 10: Survey Results Reveal High Satisfaction with Hearing Aids. Audiology Online. Course#: 34300
- Spencer, C., Bennett, S., Peters., L. (2019). Industry Research - Patient Satisfaction with Hearing Aids and Machine-Learning in Real-Life Listening Environments. Canadian Audiologist,
DISCLAIMER
Participants were not paid for their participation. Subjects had the option to purchase the hearing aids following the study at a discounted rate. The discount was not presented to them until following the study. Craig Spencer is an Audiologist working for WS Audiology Canada Inc. Contact at craig.spencer@widexsound.com for more information.