What is “Effective Quiet” for Music and Noise?

Back to Basics is a monthly column written by Marshall Chasin for the Hearing Review. Permission has been granted to reprint some of these columns in Canadian Audiologist.
Music and noise have many similarities (and differences). One similarity is that many types of music and noise have quiet and loud periods. In music, it may be the percussion and horn section that contributes most of the music energy, or conversely, it may be the woodwind section that provides the quieter, more-mellow aspects to music. In noise, there may be percussive elements such as in a stamping plant, or a rivet gun that provide the peaks to the noise level, and then perhaps there is a more “steady state” lower level din that permeates the work space when the riveters take a break.
This has caused researchers – mostly in the 1970s and early 1980s – to look at the highest level in any particular frequency region that would just begin to cause some temporary threshold shift (TTS). Specifically the “critical level” is the highest level at any one frequency that would cause 5 dB of TTS, and “effective quiet” is the highest level that would not cause any TTS.
We have all experienced TTS and have lived to tell the tale. After attending a rock concert or sometimes even after cutting our lawn, our ears appear to be numb or perhaps we have some tinnitus. If I were to measure your hearing at that point, and compare it with your hearing just before you went to the concert, that difference would be the TTS. As the name suggests, TTS is temporary, and contrary to our intuition, it turns out that there is no correlation between TTS and eventual permanent hearing loss – at most one can say that before having some permanent noise or music induced hearing, one has had to have experienced some TTS. Nevertheless, short of doing an experiment where researchers knowingly ruin someone’s hearing (for the benefit of science), they are limited by doing TTS studies where the effect is temporary.
The estimation of “effective quiet” levels is an attempt to get a handle on how safe any given environment is, on a frequency-by-frequency basis. This would have ramifications for the use of hearing protection devices – one can simply subtract the attenuation at any desired frequency from the measured environmental spectrum of the noise or music, and determine whether it is below the “effective quiet” level. In most cases, when you do the math, less is typically better than more, especially when it comes to music.
The figure below shows four curves- one is the average data from Mills, Gilbert, and Adkins1 (1979) (in which they summarize 7 previous studies) across the frequency region for “Effective Quiet” levels- sound levels that would be necessary to create TTS. The other three curves are the actual measured “average” sound levels (measured in my Musicians’ Clinic over the past 30 years) for three musical instruments- the clarinet, violin, and the trumpet.
| 250 | 500 | 1000 | 2000 | 4000 | |
|---|---|---|---|---|---|
| Effective Quiet | 82 | 82 | 82 | 78 | 74 |
| Clarinet | 77 | 79 | 75 | 70 | 59 |
| Violin | 79 | 81 | 75 | 72 | 62 |
| Trumpet | 86 | 87 | 78 | 72 | 63 |
Table 1. The average frequency-by-frequency sound levels (dB SPL) measured for three instruments in a classical domain as compared with estimates of Effective Quiet (in red italics) that would create 5 dB of TTS. Except for the trumpet in the lower frequency region (red non-italics), the average playing levels were below the Effective Quiet levels. The ranges of the musical instruments were not shown, but some instruments did exceed the Effective Quiet levels by 8–10 dB, implying that hearing protection of 8–10 dB would be useful.
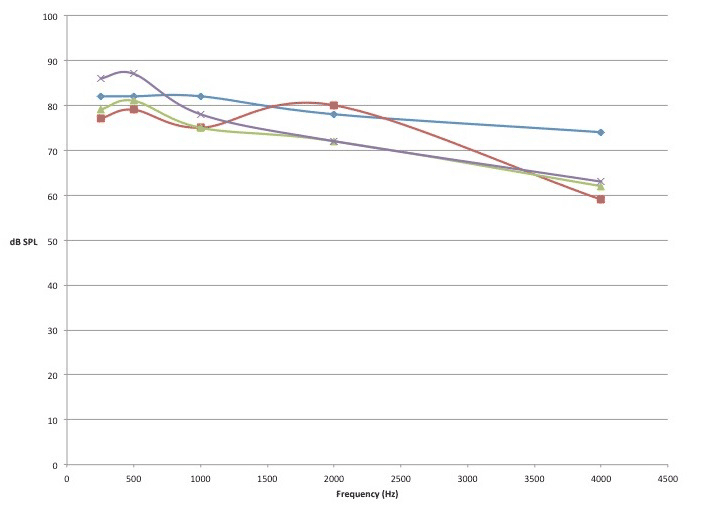
Several things are apparent in this figure. Other than the trumpet in the lower frequency region, the average playing levels of the instruments do not exceed the Effective Quiet level. Of course, these are average playing levels and there were some violins and trumpet players who did indeed exceed these levels. The other thing is that if you examine the slope or shape of the Effective Quiet data, it falls off in the 2000–4000 Hz region. That is, it seems that it takes less sound energy to create TTS in the higher frequency region. However- and this almost seems like it’s too good to be true- but the sound emanating from these musical instruments are inherently of a lower level in these higher frequency regions – the spectra of these musical instruments seem to parallel the Effective Quiet curve, as if our auditory systems innately were designed to accept music with minimal auditory damage. This, however, would not be the case with all musical instruments such as the drums which generate significant mid and high frequency energy that far exceeds the Effective Quiet levels at 2000 and 4000 Hz.
Reference
1. Mills JH, Gilbert RM, and Adkins WY. Temporary threshold shifts in humans exposed to octave bands of noise for 16 to 24 hours. Journal of the Acoustical Society of America 1979;65(5):1238–48.
From Back to Basics Hearing Review- used with permission