Industry Research: A Canadian Evaluation of Real-Life Satisfaction of Hearing Aids with Direct Connectivity

A previous clinical study, A Canadian Evaluation of Real-Life Satisfaction of Hearing Aids in Challenging Environments.1 was a Canadian based clinical trial which provided empirical evidence of the efficacy on the Widex Unique platform. This study provided clinicians with clinical data to better utilize evidence based practice in their hearing aid prescribing practices. Another Canadian based clinical trial was conducted with the Widex Beyond platform. The purpose of this second study was twofold: (1) To replicate and thus further validate the evidence from the 2016 study, (2) and to provide empirical evidence of the efficacy of direct connectivity to iPhones in hearing aids.
Methods
This clinical study was executed via the Widex Patient Experience Program (PEP). It was conducted from December 1st, 2016 to March 1st, 2017 and included 69 subjects at 24 clinics across Canada (Figure 1). Subjects were asked to evaluate the Widex Beyond 440 (B-F2 440) hearing aids and compare them to their existing hearing aids, both prior to and following the trial. Subjects were also specifically asked to evaluate connectivity features specific to B-F2 440 hearing aids, including streaming cellular phone calls, streaming music/audio, and use of the B-F2 MFi (Made-for-iPhone) App. A subjective Satisfaction Questionnaire, based upon that used in the MarkeTrak IX, discussed in the 2016 study, was implemented.
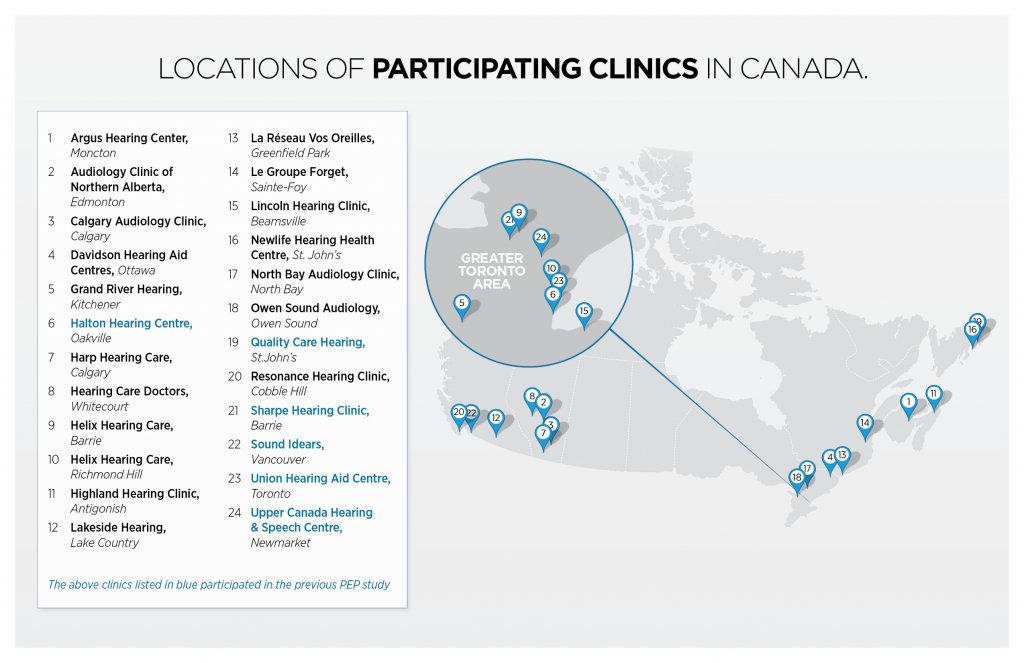
Figure 1. Participating clinics.
Participating Clinics
Significant effort was made to select clinics to best represent typical clinic practices across Canada. Of the 24 participating clinics, 18 were new clinics to PEP (see Figure 1). Inclusion of new participating clinics strengthens the replicability of the data.
Subject Inclusion Criteria
To provide data suitable for real Canadian clinical conditions, broad selection criteria for patients was important. Inclusion criteria was consistent with A Canadian Evaluation of Real-Life Satisfaction of Hearing Aids in Challenging Environments.1 Specific inclusion criteria were added for investigation of direct connectivity features. Criteria for inclusion included: all types and configurations of hearing loss, hearing loss within the fitting range of the hearing aid, and, where possible, experienced hearing aid wearers, non-Widex hearing aid wearers, and high-end hearing aid wearers. Participants had to be fluent and literate in in either English or French to complete the satisfaction questionnaires.
In order to assess direct connectivity features, subjects needed to have: Apple iPhone 4s or newer running iOS 7.0 or later. The criteria also encouraged selection of individuals currently wearing another manufacturer’s made-for-iPhone hearing aid.
Procedural Summary
Hearing aids were programmed using Compass GPS software. Clinicians were asked to fit the devices using the Widex Fitting Rationale and were given instructions to execute the study as well as fitting recommendations/guidelines. All patients were assessed, fit, and counselled in accordance with best-practice procedures as deemed appropriate by the clinician.
Patients were asked to evaluate their current hearing aids, B-F2 440 hearing aids and then their current hearing aids again. Three separate satisfaction questionnaires were administered. Satisfaction Questionnaire 1 (SQ1) was administered initially with the patients existing hearing aids prior to the trial. Satisfaction Questionnaire 2 (SQ2) was administered following the trial with B-F2 440 hearing aids. Satisfaction Questionnaire 3 (SQ3) was administered following use of current hearing aids again.
The Satisfaction Questionnaires were rated on a scale of 1 to 7 where 1 -3 represent dissatisfied, 4 represents neutral and 5 -7 represents satisfied. A score of 1 indicates complete dissatisfaction while a score of 7 represents complete satisfaction. Clinicians were instructed to not discuss price of new hearing aids until the completion of SQ3.
Overall Results
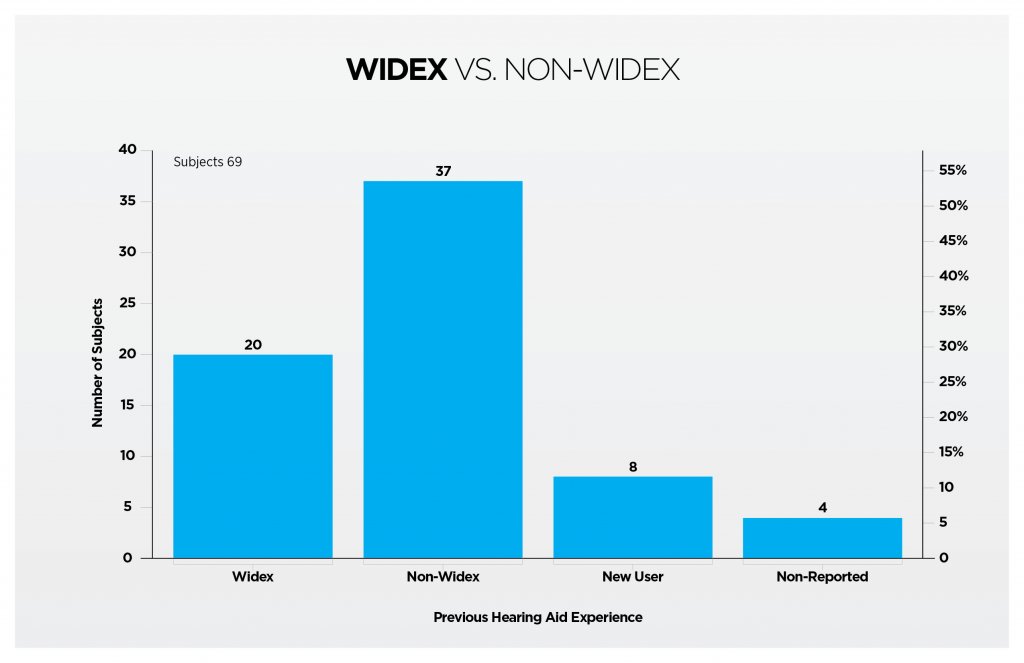
The data is representative of primarily experienced users, currently using a variety of both Widex and non-Widex hearing aids. A multi-manufacturer sample eliminates bias toward subjects being pre-conditioned to a specific hearing aid manufacturer’s sound. Of the 69 subjects included in the study, 61 subjects identified as experienced users and 8 subjects identified as new hearing aid users. 20 subjects currently had Widex Hearing aids and 41 subjects had non -Widex hearing aids. A breakdown of this distribution can be seen in Figure 2.
Results indicated a clear improvement in B-F2 440 hearing aids compared to subject’s current hearing aids and are presented in Table 1. Results are presented for each category, describing the relevant hearing aid feature or listening situation comparing responses from SQ1 (Satisfaction Questionnaire 1) to those of SQ2 (Satisfaction Questionnaire 2), and comparing responses from SQ2 (Satisfaction Questionnaire 2) to those of SQ3 (Satisfaction Questionnaire 3). A positive mean difference score indicates a higher satisfaction rating. This result was observed when comparing responses from SQ2 (obtained after the B-F2 440 trial), relative to those obtained from both the SQ1 and SQ3 (after wearing their current hearing aids). A significant P-value (P<0.05), for both Paired T-tests and Wilcoxon Signed-Rank tests indicates a statistically significant difference in scores between SQ2 and both SQ1 and SQ3. A positive mean difference score and a significant p-value indicates improved satisfaction with B-F2 440 hearing aids. All the mean difference scores between SQ2 to SQ1 and SQ2 to SQ3 are positive, indicating increased satisfaction with B-F2 440 hearing aids across all listening categories (Table 1). In the majority of cases, the mode is higher for SQ2 compared to SQ1 and SQ3 with the exception of 7 categories where the mode is equal for SQ2 and one of SQ1 or SQ3. Overall there was no significant difference between SQ1 and SQ3, where subjects were comparing experiences before and after with their own hearing aids.
Table 1. Hearing Aid Comparison Data Chart
| Category | Mean SQ1 | Mean SQ3 | Mean SQ2 | Mode SQ1 | Mode SQ3 | Mode SQ2 | Mean Difference Scores SQ1- SQ2 | Mean Difference Scores SQ2 -SQ3 | P-value SQ 1-SQ2 | P-value SQ2-SQ3 |
| Overall Satisfaction | 4.82 | 4.53 | 5.81 | 5 | 5 | 6 | 1.09 | 1.22 | 0.001 | <0.0001 |
| Adjustments Using a smartphone app | 2.39 | 2.82 | 3.85 | 1 | 1 | 5 | 1.54 | 1.00 | 0.0004 | 0.0183 |
| Overall Sound Quality | 4.83 | 4.66 | 6.18 | 6 | 5 | 6 | 1.31 | 1.51 | <.0001 | <0.0001 |
| Natural Sounding | 4.83 | 4.74 | 5.85 | 6 | 6 | 7 | 1.17 | 1.16 | 0.0002 | <0.0001 |
| Comfort when listening to loud sounds | 4.68 | 4.50 | 5.60 | 5 | 5 | 6 | 0.96 | 1.10 | 0.0008 | 0.0003 |
| Ability to hear soft sounds | 3.90 | 3.91 | 5.57 | 3 | 5 | 7 | 1.85 | 1.65 | <.0001 | <0.0001 |
| The sound of own voice | 4.90 | 5.02 | 5.77 | 6 | 7 | 7 | 1.06 | 0.87 | 0.0005 | 0.0060 |
| Ability to minimize background noise | 3.78 | 3.81 | 5.12 | 1 | 3 | 6 | 1.38 | 1.33 | <.0001 | <0.0001 |
| Use in noisy backgrounds | 3.54 | 3.64 | 5.08 | 1 | 2 | 5 | 1.80 | 1.56 | <.0001 | <0.0001 |
| Ability to tell direction from which sound is coming | 4.03 | 4.22 | 5.34 | 4 | 4 | 6 | 1.37 | 1.30 | <.0001 | <0.0001 |
| Ability to tell if a sound is far or near | 4.43 | 4.39 | 5.55 | 6 | 4 | 6 | 1.31 | 1.27 | <.0001 | <0.0001 |
| Ability to mask or reduce the negative effects of tinnitus | 4.14 | 4.16 | 4.88 | 4 | 2 | 4 | 1.00 | 0.80 | 0.0295 | 0.0740 |
| When trying to follow conversations in noise | 3.39 | 3.43 | 5.14 | 1 | 2 | 6 | 1.75 | 1.80 | <.0001 | <0.0001 |
| Conversation with 1 person | 5.28 | 5.38 | 6.49 | 6 | 6 | 7 | 1.22 | 1.13 | <.0001 | <0.0001 |
| In small groups | 4.26 | 5.03 | 5.93 | 5 | 5 | 6 | 1.69 | 0.91 | <.0001 | 0.0001 |
| Outdoors | 4.67 | 5.00 | 6.00 | 6 | 6 | 6 | 1.24 | 0.94 | <.0001 | <0.0001 |
| In large groups | 3.13 | 3.60 | 4.93 | 1 | 3 | 5 | 1.93 | 1.47 | <.0001 | <0.0001 |
| In a store, when shopping | 3.97 | 4.24 | 5.47 | 3 | 3 | 6 | 1.60 | 1.33 | <.0001 | <0.0001 |
| Talking to children | 4.05 | 4.42 | 5.80 | 3 | 4 | 6 | 1.83 | 1.43 | <.0001 | <0.0001 |
| At a movie | 4.34 | 4.78 | 5.93 | 6 | 5 | 7 | 1.43 | 1.22 | <.0001 | <0.0001 |
| In a place of worship | 4.31 | 4.68 | 5.46 | 4 | 4 | 6 | 1.57 | 0.69 | 0.0003 | 0.0769 |
| Watching TV with others | 4.27 | 4.62 | 5.66 | 3 | 5 | 6 | 1.43 | 1.07 | <.0001 | 0.0002 |
| In a restaurant | 3.72 | 4.18 | 5.28 | 2 | 5 | 6 | 1.74 | 1.15 | <.0001 | <0.0001 |
| Riding in a car | 4.26 | 4.54 | 5.95 | 5 | 5 | 6 | 1.76 | 1.35 | <.0001 | <0.0001 |
| Listening to music | 4.50 | 4.48 | 6.02 | 6 | 5 | 7 | 1.57 | 1.52 | <.0001 | <0.0001 |
| Work place | 4.63 | 4.59 | 5.79 | 6 | 6 | 6 | 1.51 | 1.20 | <.0001 | 0.0007 |
| Leisure activities (exercising, walking, etc.) | 4.78 | 4.96 | 5.74 | 5 | 4 | 6 | 1.04 | 0.75 | <.0001 | 0.0029 |
| Conversation in trains, planes, buses | 3.91 | 4.27 | 5.49 | 6 | 3 | 6 | 1.25 | 1.18 | 0.0004 | 0.0019 |
| On a noisy street | 3.55 | 3.94 | 5.16 | 2 | 3 | 6 | 1.69 | 1.35 | <.0001 | <0.0001 |
| Overall, across all listening situations | 4.21 | 4.43 | 5.85 | 5 | 4 | 6 | 1.70 | 1.38 | <.0001 | <0.0001 |
| Outdoors on a windy day | 3.51 | 4.19 | 5.22 | 3 | 5 | 5 | 1.70 | 1.12 | <.0001 | 0.0002 |
| Walking or running outdoors | 4.05 | 4.65 | 5.68 | 4 | 5 | 7 | 1.64 | 1.04 | <.0001 | <0.0001 |
| Overall sound quality when streaming | 4.74 | 4.96 | 6.07 | 6 | 4 | 7 | 1.38 | 1.11 | 0.0023 | 0.0021 |
| Clarity of the sound when streaming | 4.68 | 5.10 | 6.02 | 6 | 7 | 7 | 1.46 | 0.93 | 0.0016 | 0.0068 |
| Sound quality of speech when streaming in default streaming program (the Universal program in Beyond) | N/A | N/A | N/A | N/A | N/A | 7 | N/A | N/A | N/A | N/A |
| Sound quality of speech when streaming in the Music program In Beyond | N/A | N/A | 5.87 | N/A | N/A | 7 | N/A | N/A | N/A | N/A |
| Sound quality of music when streaming in default streaming program | N/A | N/A | 5.96 | N/A | N/A | 7 | N/A | N/A | N/A | N/A |
| Sound quality of music when streaming in the Music program in Beyond | N/A | N/A | 6.09 | N/A | N/A | 7 | N/A | N/A | N/A | N/A |
| iPhone/Smartphone app overall | N/A | N/A | 5.73 | N/A | N/A | 7 | N/A | N/A | N/A | N/A |
| Ease-of-use of iPhone/Smartphone app | N/A | N/A | 5.92 | N/A | N/A | 7 | N/A | N/A | N/A | N/A |
| Adjusting the sound using iPhone/Smartphone app | N/A | N/A | 6.10 | N/A | N/A | 7 | N/A | N/A | N/A | N/A |
The strength of the data is best exemplified through presentation of the distributions for each category. Six specific listening situations relevant to clinical and subject use were selected to highlight this information: (1) Overall Satisfaction; (2) Overall Sound Quality; (3) Satisfaction in Noisy Environments; (4) Satisfaction Outdoors on a Windy Day; (5) When Trying to Follow a Conversation in Noise; and (6) When Listening to Music.
Overall Satisfaction
On Satisfaction Questionnaire 1 (SQ1), when subjects rated their current hearing aids for Overall Satisfaction, 17 respondents (28%) rated as “dissatisfied,” 1 (2%) rated as “neutral” and 40 (67%) rated as “satisfied,” with 12 (20%) respondents reporting a satisfaction score of 7 (Figure 3). When evaluating Overall Satisfaction with B-F2 440 on SQ2, 6 (10%) respondents reported “dissatisfied,” 3 (5%) “neutral” and 51 (85%) “satisfied” with 22 (37%) respondents reporting a satisfaction score of 7 (see Figure 3).
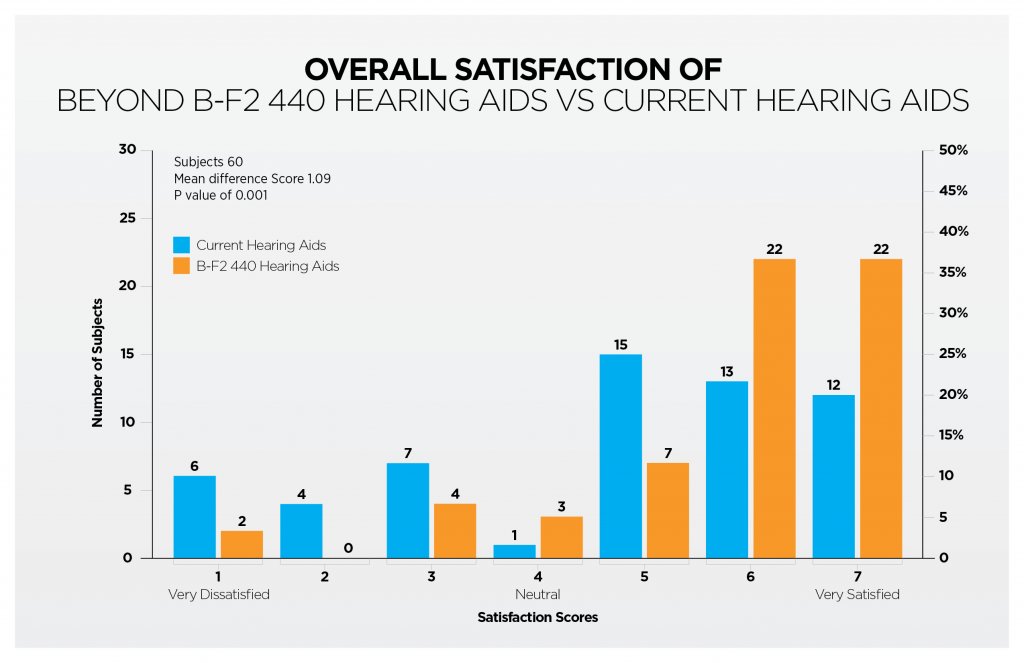
The left-to-right shift that is evident when comparing the distributions of SQ1 and Satisfaction Questionnaire 2 (SQ2) in Figure 3 indicates a clear movement of respondents rating improved overall satisfaction when wearing the B-F2 440 hearing aid. The mean shift per subject is 1.3. The largest increase was at the satisfaction rating of “7” where 10 additional respondents selected this score on SQ2 compared to SQ1.
Overall Sound Quality
On SQ1, when subjects rated their current hearing aids for Overall Sound Quality 9 respondents (16%) rated as “dissatisfied,” 14 (23%) rated as “neutral” and 36 (60%) rated as “satisfied,” with 9 (16%) respondents reporting a satisfaction score of 7 (Figure 4). When evaluating Overall Sound Quality with B-F2 440 on SQ2, 2 (4%) respondents reported “dissatisfied,” 1 (2%) “neutral” and 49 (86%) “satisfied” with 16 (28%) respondents reporting a satisfaction score of 7 (see Figure 4).
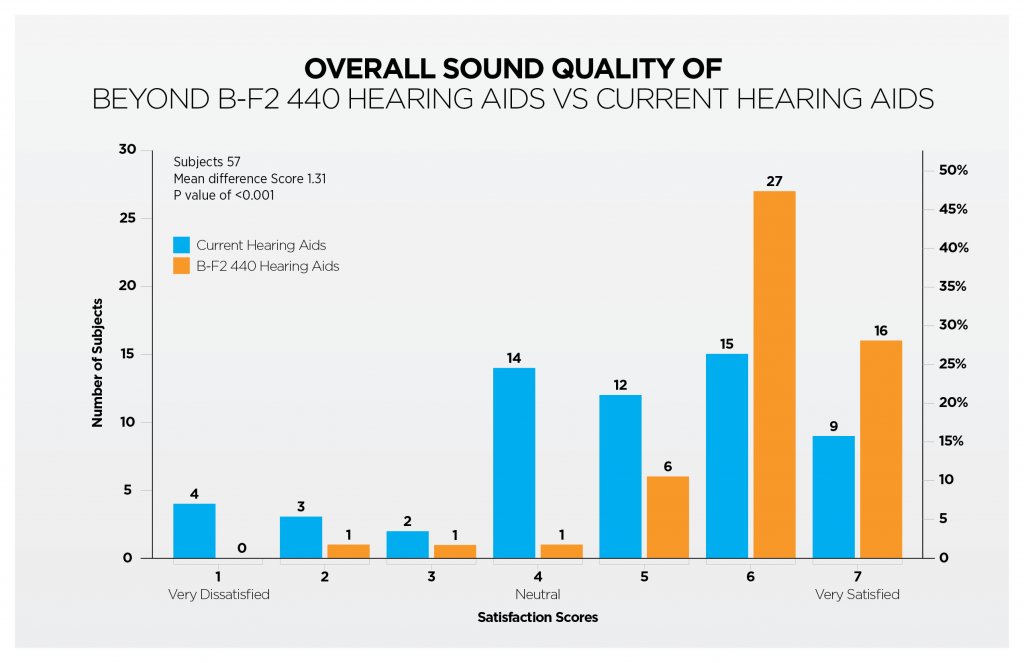
A left-to-right shift is evident when comparing the distributions of SQ1 and SQ2 in Figure 4 indicates clear movement of respondents rating improved satisfaction in overall sound quality when wearing the B-F2 440 hearing aid. The mean shift per subject is 1.3. The largest increase was at the satisfaction rating of “6” where 12 additional respondents selected this score on SQ2 compared to SQ1. The next largest change was at the satisfaction rating of “4” where 13 less respondents selected this score on SQ2 compared to SQ1 indicating these respondents shifted their satisfaction score positively when using B-F2 440 hearing aids.
Satisfaction in Noisy Environments
On SQ1, when subjects rated their current hearing aids for Satisfaction in Noisy Environments, 31 respondents (54%) rated as “dissatisfied”, 6 (11%) rated as “neutral” and 20 (35%) rated as “satisfied”, with 5 (9%) respondents reporting a satisfaction score of 7 (Figure 5). When evaluating Satisfaction in Noisy Environments with B-F2 440 on SQ2, 10 (18%) respondents reported “dissatisfied”, 8 (14%) “neutral” and 43 (75%) “satisfied” with 12 (21%) respondents reporting a satisfaction score of 7 (Figure 5).
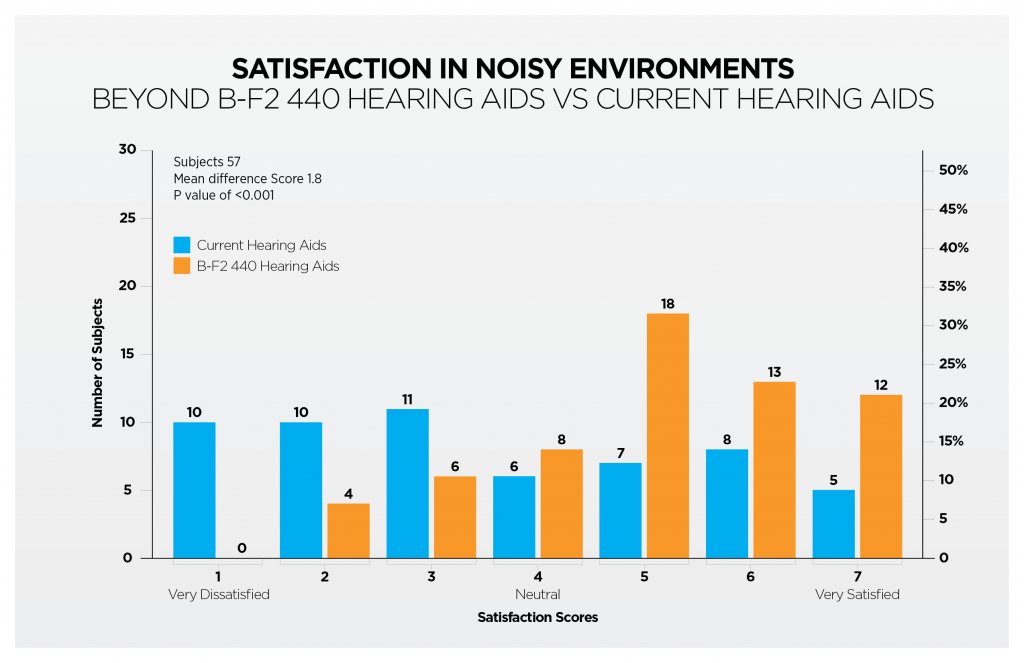
The left-to-right shift that is evident when comparing the distributions of SQ1 and SQ2 in Figure 5 indicates respondents rating improved satisfaction in noisy environments when wearing the B-F2 440 hearing aid. The mean shift per subject is 1.8. The largest increase was for the satisfied rating as 23 more respondents rated as satisfied on SQ2 compared to SQ1.
Satisfaction Outdoors on a Windy Day
On SQ1, when subjects rated their current hearing aids for Satisfaction Outdoors on a Windy Day, 31 respondents (48%) rated “dissatisfied”, 10 (16%) rated as “neutral” and 18 (28%) rated as “satisfied,” with 3 (5%) respondents reporting a satisfaction score of 7 (Figure 6). When evaluating Satisfaction Outdoors on a Windy Day with B-F2 440 on SQ2, 7 (11%) respondents reported “dissatisfied,” 8 (12%) “neutral” and 49 (77%) “satisfied” with 18 (28%) respondents reporting a satisfaction score of 7 (Figure 6).
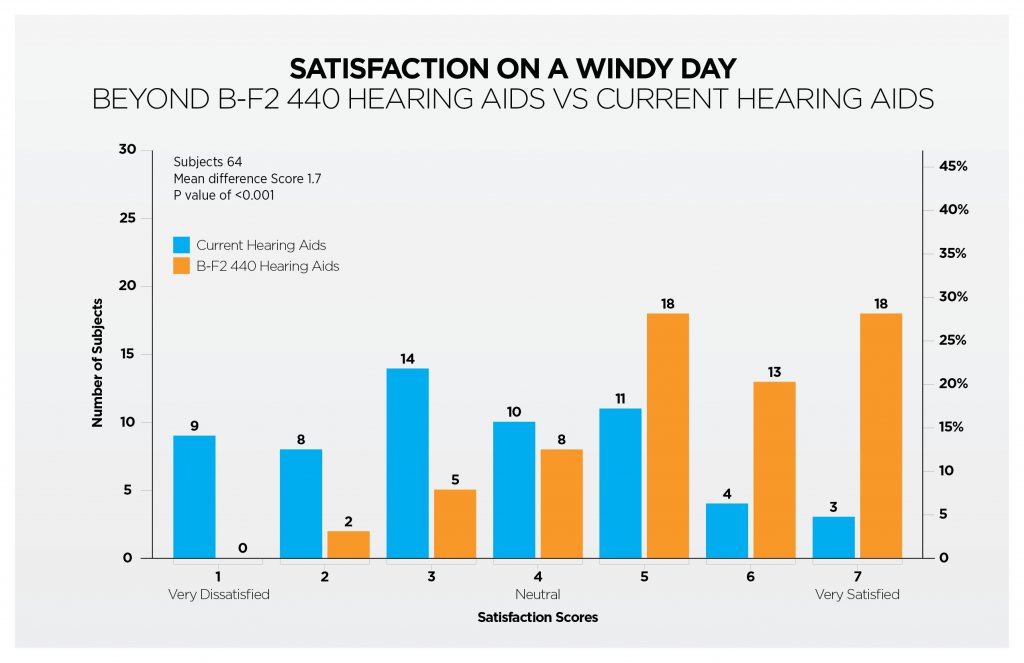
A left-to-right shift that is evident when comparing the distributions of SQ1 and SQ2 in Figure 6 indicates a clear movement of respondents rating improved satisfaction when outdoors on a windy day when wearing the B-F2 440 hearing aid. The mean shift per subject is 1.7. The largest increase was at the satisfaction rating of “7” where 15 additional respondents selected this score on SQ2 compared to SQ1. 31 more respondents reported as “satisfied” on SQ2 compared to SQ1.
When Trying to Follow a Conversation in Noise
On SQ1, when subjects rated their current hearing aids for When Trying to Follow a Conversation in Noise 36 respondents (61%) rated as “dissatisfied,” 7 (12%) rated as “neutral” and 19 (32%) rated as “satisfied,” with 6 (10%) respondents reporting a satisfaction score of 7 (Figure 7). When evaluating Satisfaction Outdoors on a Windy Day with B-F2 440 on SQ2, 8 respondents (14%) reported “dissatisfied,” 9 (15%) “neutral” and 42 (71%) “satisfied” with 8 respondents (14%) reporting a satisfaction score of 7 (Figure 7).
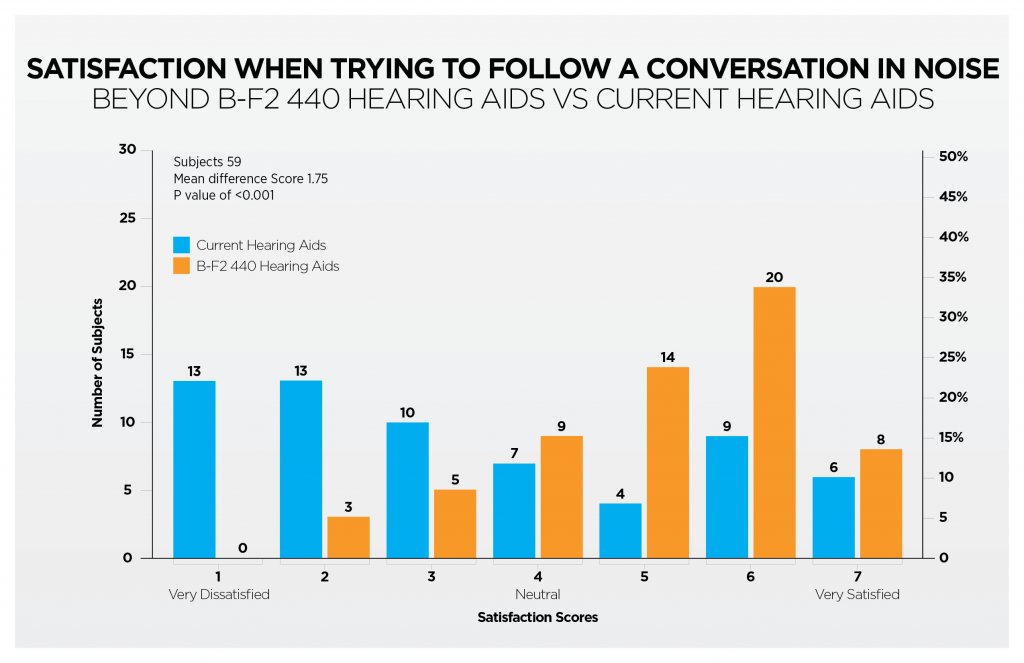
The left-to-right shift that is evident when comparing the distributions of SQ1 and SQ2 in Figure 7 indicates a clear movement of respondents rating improved satisfaction when trying to follow a conversation in noise when wearing the B-F2 440 hearing aid. The mean shift per subject is 1.75. The largest increase was at the satisfaction rating of “6” where 11 additional respondents selected this score on SQ2 compared to SQ1. 23 more respondents reported as “satisfied” on SQ2 compared to SQ1, with zero respondents reporting completely dissatisfied.
When Listening to Music
On SQ1, when subjects rated their current hearing aids for Satisfaction When Listening to Music 16 respondents (27%) rated as “dissatisfied,” 13 (22%) rated as “neutral” and 32 (53%) rated as “satisfied,” with 6 (10%) respondents reporting a satisfaction score of 7 (Figure 8). When evaluating Satisfaction When Listening to Music with B-F2 440 on SQ2, 3 respondents (5%) reported as “dissatisfied”, 4 (7%) “neutral” and 53 (88%) “satisfied” with 26 (43%) respondents reporting a satisfaction score of 7 (Figure 8).
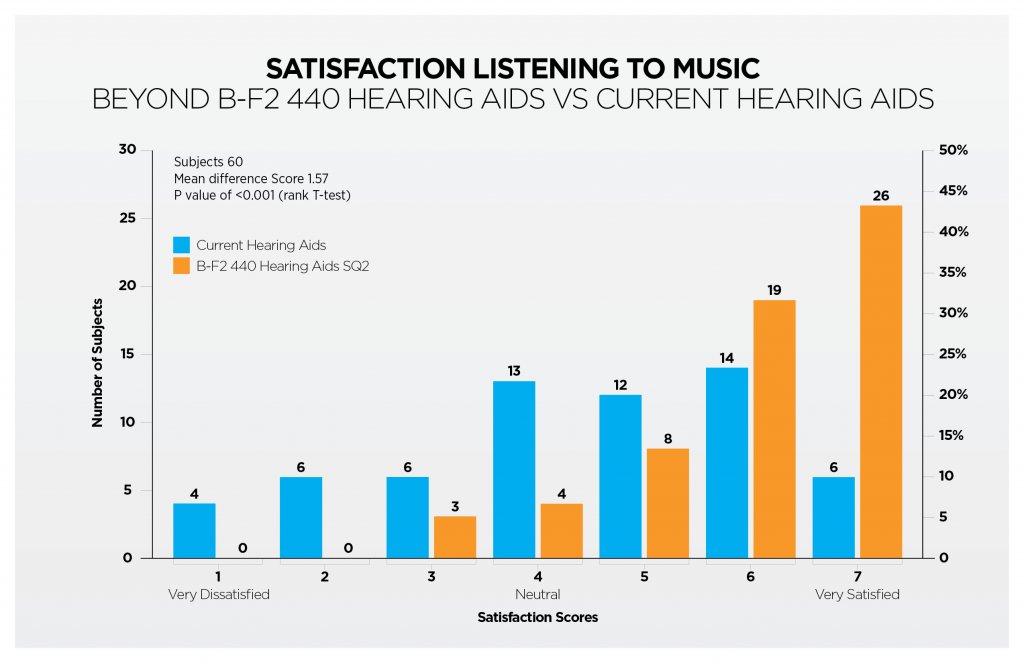
A left-to-right shift is evident when comparing the distributions of SQ1 and SQ2, in Figure 8 indicates a clear movement of respondents rating improved satisfaction when trying to follow a conversation in noise when wearing the B-F2 440 hearing aid. The mean shift per subject is 1.57. The largest increase was at the satisfaction rating of “7” where 20 additional respondents selected this score on SQ2 compared to SQ1. 40 more respondents reported as “satisfied” on SQ2 compared to SQ1.
Connectivity Comparisons
Perceived satisfaction of sound quality when wearing the B-F2 440 in four specific streaming situations was also evaluated: (1) Sound quality of speech when streaming while in the default listening program (the Universal program in Beyond); (2) Sound quality of speech when streaming while in a dedicated Music program; (3) Sound quality of music when streaming in the default listening program; and (4) Sound quality of music when streaming while in a dedicated Music program.
All four of these situation questions showed strong satisfaction scores for streaming with Beyond, as seen in Table 1. Specific data of note are the situations of sound quality of speech when streaming while in the default listening program (the Universal program in B-F2 440 hearing aids), and sound quality of music when streaming while in a dedicated Music program in B-F2 440 hearing aids, as well as Ease of App Use (Figure 9).
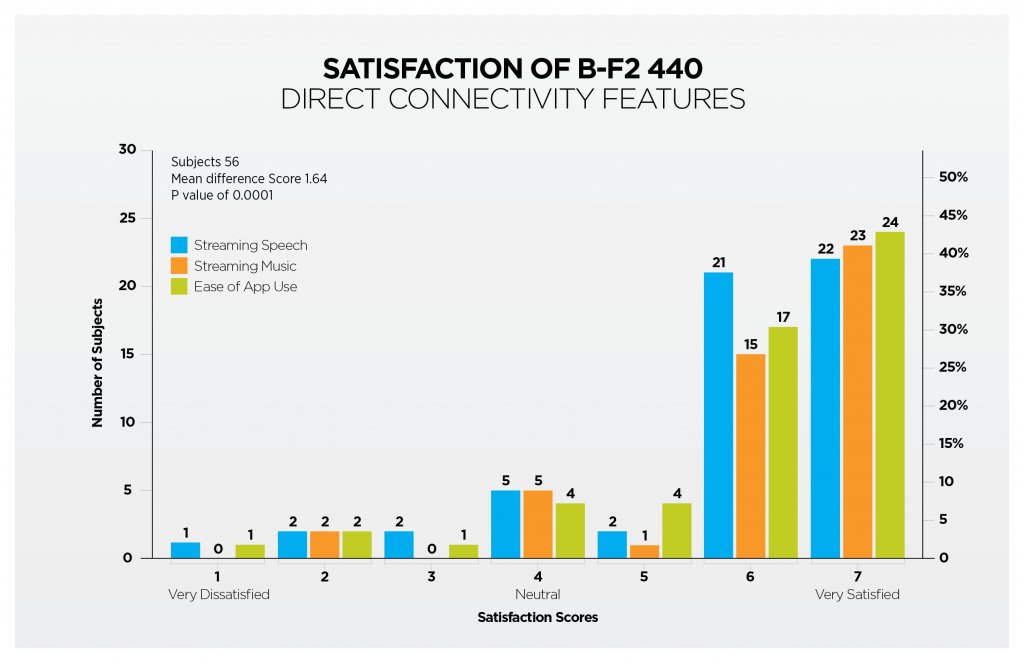
In relation to perceived sound quality of speech when streaming while in the default listening program, 43 subjects (78%) reported a satisfaction score of 6 or 7 indicating that they are satisfied, while only one subject responded as completely dissatisfied. In relation to perceived sound quality of music when streaming while in a dedicated Music program, 38 subjects (83%) reported a satisfaction score of 6 or 7 – indicating that they are satisfied, while no subjects responded as completely dissatisfied. Both conditions responded with a mode of 7. These results are supportive of the fact that subjects report high satisfaction with sound quality relating to streaming functionality in the B-F2 440 hearing aids.
Comparative Streaming Results
Nineteen subjects reported streaming regularly with their current hearing aids. This included streaming through an intermediary or directly to their iPhone. Eighteen subjects reported their hearing aids had direct connectivity capabilities, and of those 18, only 4 had verifiable direct connectivity hearing aids. Results when comparing the mean difference scores for the 19 subjects who reported streaming regularly with their current hearing aids on SQ1 compared to that for SQ2 indicated a significant mean difference score evidenced in Table 1.
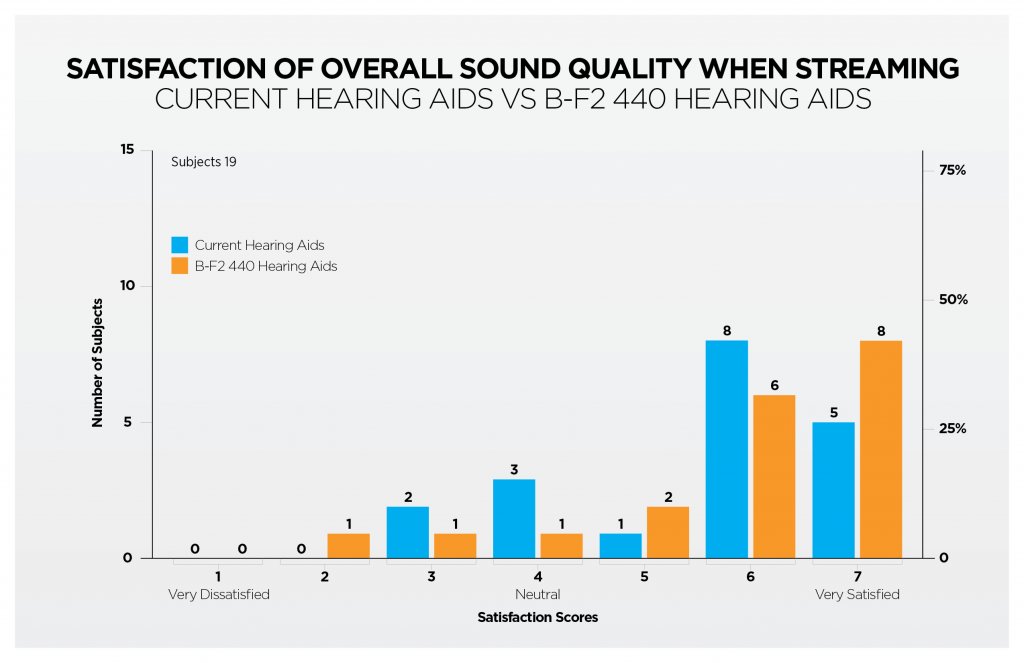
On SQ1, when subjects rated their current hearing aids for Overall sound quality when streaming, 2 respondents (11%) rated as “dissatisfied,” 3 (16%) rated as “neutral” and 14 (74%) rated as “satisfied”, with 5 of those respondents (26%) reporting a satisfaction score of 7 (Figure 10). When evaluating Overall sound quality when streaming with B-F2 440 on SQ2, 2 respondents (11%) reported as “dissatisfied,” 1 (5%) “neutral” and 16 (89%) “satisfied” with 8 (44%) respondents reporting a satisfaction score of 7 (Figure 10).
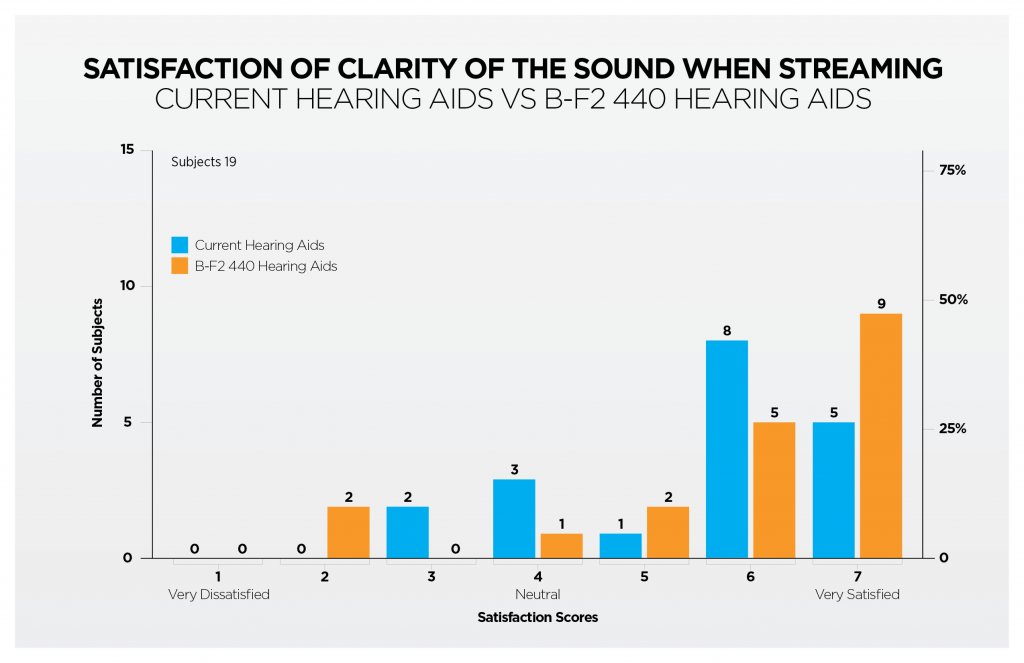
On SQ1, when subjects rated their current hearing aids for Clarity of the sound when streaming, 2 respondents (11%) rated as “dissatisfied”, 3 (17%) rated as “neutral” and 14 (78%) rated as “satisfied”, with 5 (28%) respondents reporting a satisfaction score of 7 (Figure 10). When evaluating Clarity of the sound when streaming with B-F2 440 on SQ2, 2 respondents (11%) reported “dissatisfied”, 1 (5%) “neutral” and 14 (78%) “satisfied” with 9 respondents (50%) reporting a satisfaction score of 7 (Figure 11).
Conclusions
The data clearly indicates significant improvement in user satisfaction with B-F2 440 hearing aids across all listening environments compared to users’ current hearing aids. This PEP clinical study demonstrates significant improved satisfaction with B-F2 440 Fusion hearing aids in all environments, as compared to the users’ current hearing aids, independent of manufacturer. Users reported increased satisfaction ratings across all listening categories. The improvement is clearly seen in the highlighted qualities relating to Overall satisfaction, overall sound quality, Satisfaction in Noisy Environments, Satisfaction Outdoors on a Windy Day, When Trying to Follow a Conversation in Noise and When Listening to Music
These results are consistent with A Canadian Evaluation of Real-Life Satisfaction of Hearing Aids in Challenging Environments,1 where overall data clearly indicated an improvement in user satisfaction when subjects were wearing U-FS 440 hearing aids. As B-F2 440 and U-FS 440 hearing aids share the same core platform, this strengthens the clinical evidence supporting efficacy of these hearing aids in clinical use.
Direct connectivity categories show significant satisfaction scores for B-F2 440 hearing aids, in particular when streaming in the specific categories of sound quality of speech when streaming in the default listening program and sound quality of music when streaming in the dedicated music program.
This study supports a direct application of its results to real-life clinical settings in Canada, and it demonstrates that the premium technology available in the Beyond Platform provides substantial improvement in user satisfaction for individuals with hearing loss.
Disclaimer
The Canadian clinical trial for Beyond had 24 clinics participate. No financial incentive of any kind was given to the clinician/clinics or patients that participated. The patients were also not given any pricing incentive on the Beyond hearing aids to participate in the trial.
References
- Kalef R, Adam A, Davidson-Bertrand J, et al. A Canadian Evaluation of Real-Life Satisfaction of Hearing Aids in Challenging Environments. Can Aud 2016;3(5). Available at: http://www.canadianaudiologist.ca/a-canadian-evaluation-feature/