Research Project: Hidden Hearing Loss in Music Students

Editors note: Data leading to a dysfunction referred to as cochlear synaptopathy (also colloquially referred to as hidden hearing loss) has been appearing in the literature since 2000. Since that time researchers have looked at measures ranging from the SP/AP ratio to amplitude measures of the Wave I/Wave V ratio, and to various measures of speech-in-noise testing. This interesting pilot study by some students at the University of British Columbia, under the guidance of Dr. Navid Shanaz examines a range of typical audiometric measures, as well as some that are designed to examine more central areas of possible dysfunction. While statistical significance was not achieved for any of the measures, this pilot is quite important to underscore the importance of finding the potential next audiometric test(s) in order to examine this allusive auditory dysfunction.
Abstract
Background
Noise exposure can cause hidden hearing loss through synaptic deficits between inner hair cells and auditory nerve fibers. The resulting cochlear neural degeneration can cause decreased performance with a speech in noise, despite the presence of normal hearing thresholds. The current study seeks to aid in the development of a reliable test battery that will lead to a better understanding and diagnosis of hidden hearing loss.
Methods
Six music students and 6 normal hearing participants were recruited. Both groups completed questionnaires concerning noise-exposure and underwent a rigorous test battery comprised of the standard audiometric test as well as extended high-frequency testing and central auditory processing assessments.
Results
The music group was found to have significantly higher scores on the noise exposure questionnaire (NEQ) than the NH group. Behavioural audiometric thresholds for all subjects were within normal limits. A significant interaction between thresholds as measured in equivalent sound-pressure levels (RETSPLs) and the group was found but no differences were found at any specific frequencies. No significant differences were found in any other measures used in this study.
Conclusions
The small sample size was a limitation of our study. In addition, the type of noise exposure for our hidden hearing loss group (music students) is different from most of the previous research which could contribute to the lack of significant differences between groups.
There is a noise exposure epidemic that is causing hearing damage to our population of an unknown magnitude. Although both may result from noise exposure, hidden hearing loss (HHL) is distinct from traditional sensorineural hearing loss associated with outer hair cell damage.1 The reason why this type of hearing loss is “hidden” is because behavioural and electrophysiological thresholds are not typically elevated until the damage is extensive.2 The prevalence and impact of HHL cannot be accurately assessed, as a thorough diagnostic test battery has not yet been developed.
Cochlear synaptopathy has been proposed as a theory to account for HHL.3 Cochlear neural degeneration is evidenced by synaptic ribbon damage that inhibits the functional connection between inner hair cells and auditory nerve fibers.3 The inner hair cells are left intact and therefore, conventional audiometric thresholds remain unaffected by this damage.3 A study by Wan and Corfas suggests that HHL could be caused by cochlear neuropathy.4 It is posited that the condition could arise from cochlear Schwann cell or nodal structure pathology.4
It has been proposed that HHL falls under the broader category of central auditory processing disorder (CAPD). The condition is characterized by normal conventional audiometric thresholds with temporal processing deficits and difficulties with speech-in-noise.5 It follows that deficits in the processing of auditory stimuli may be caused by a pathology originating from the central nervous system.6 HHL can be caused by both aging and noise exposure. Aging and noise exposure has been related to temporal processing problems that cause issues with speech understanding in noise even in the absence of increased thresholds in conventional audiometry.7–12
Furthermore, animal studies indicate that aging and noise can result in a functional deterioration between inner hair cells and auditory nerve fibers.13–16 This damage results in lost synapses and subsequent degeneration of auditory nerve fibers.13–16 Sensitivity to soft sounds remains unaffected by these physiological changes, whereas there is a reduction in sensitivity to loud sounds.13
It has been theorized that HHL resulting from aging or noise exposure affects low spontaneous rate (SR) fibers that have high thresholds and code for high-level intensities.17 Therefore, these auditory nerve fibers are typically activated and required to understand speech in continuous background noise.18 High spontaneous rate fibers that are responsible for low-intensity sounds are thought to remain undamaged.13 For this reason, attaining supra-threshold information may indicate the early stages of noise-induced HHL. Some theories exist surrounding the vulnerability of low SR fibers to noise-induced damage, although there is currently no direct evidence for this correlation.17
Kujawa and colleagues found that the auditory brainstem response (ABR) Wave I, which represents auditory nerve function, is reduced in animals with noise exposure at supra-threshold levels when compared to control animals.14 Similarly, a correlation was noted between reduced Wave I amplitude and age.15 The Wave I amplitude is reduced at moderate-to-high intensities that relate to this loss of low-spontaneous rate fibers.14,15 However, contradictory results have been found in human studies, along with poor test-retest reliability. High intra-subject and inter-subject variability due to differences in head size and noise levels decrease the reliability of ABR as a diagnostic method.19–21 Contrary to animal models, several human ABR studies indicate no statistically significant changes resulting from noise exposure. The predicted decrease in ABR Wave I amplitude in the noise-exposed human population was not observed by Prendergast et al. study.21 However, the increased latency of Wave V was noted.22 Although these results provide no direct evidence for the noise-induced cochlear synaptopathy in young human populations, differences may be observed in older individuals and within the extended high-frequency range.21
Another study found no significant correlation between behavioral measurements and the existing electrophysiological animal results in the literature.21 It is suggested that the lack of correlation between animal and human study results may be due to the nature of noise exposure.22 Noise exposure in daily life is difficult to characterize and not always comparable to the noise delivered to rodents in the lab.22 The authors theorize that perhaps noise exposure that is significant enough to damage cochlear neural synapses in humans may also damage the outer hair cells, leading to the elevation of high-frequency thresholds.22
Electrocochleography results measured in the ear canal are more reliable than ABR recordings at the mastoid.23 A human study by Liberman et al revealed a significant difference between the response of the hair cells and the cochlear neural response measured with electrocochleography.10 The ratio between the summating potential (SP) and the action potential (AP) was found to be increased in the noise-exposed population.10 Another study compared the test-retest reliability of the SP/AP ratio compared to the measurement of Wave I and V amplitudes and found that the latter method produced more reliable results.23 Despite these findings, no significant differences were reported between the amplitudes of any waves measured in the two groups.23 Electrocochleography represents a non-invasive and reliable option for the assessment of differences in auditory nerve function. If intra-subject and inter-subject variability can be controlled, this may prove to be a useful diagnostic method for the detection of HHL in the future. Some other useful test batteries have been proposed to be potentially valuable in identifying HHL, are; the threshold in noise,1 Frequency Following Response (FFR), and psychophysical discrimination tasks.
Current Study Protocol
The selected test battery for the current study includes: noise exposure questionnaire, tympanometry, DPOAEs, TEOAEs, pure tone air conduction thresholds (250 Hz – 16 000 Hz), threshold-in-noise (TEN) test, QuickSIN, screener for masking level difference (MLD), and the Multiple Auditory Processing Assessment (MAPA). The current literature suggests that noise-exposed populations have decreased hearing thresholds in the extended high frequencies before the loss is observed at conventional frequencies.24,25 A recent study by Liberman et al. also observed the differences between normal hearing individuals and college music students.10 Their results noted a significant threshold elevation with extended high-frequency testing in the high-risk group, consistent with early stages of noise-induced hearing loss.10 The QuickSIN test has been used to assess the listener’s SNR loss, and to provide a functional measurement of their ability to understand speech in noise.26 The music students also demonstrated abnormally poor performance with speech testing in noise.10 The TEN tests has been found to be a good predictor of HHL in humans when paired with other tests.1 Abnormal performance on the MLD is consistent with a brainstem disorder.27 Loudness scaling was conducted to determine the dynamic range of each participant. Because HHL had been proposed to be a sub-type of CAPD, we conducted MAPA as well. MAPA testing has been recognized in the literature as an appropriate multiple-test CAPD battery.28
The current study seeks to advance our knowledge of how HHL presents clinically. It is our intention to aid in the development of a test battery that will lead to a better understanding and diagnosis of HHL. New information could lead to earlier detection of HHL, providing the opportunity for prevention and the possible development of a treatment. In addition, this knowledge could bring about the implementation of new noise exposure regulations. Music students were selected as the noise-exposed population due to their regular exposure to loud sound with the absence of hearing protection. This group is expected to have normal hearing thresholds through conventional testing but may have incurred some damage resulting from exposure to noise.
Methodology
Subjects
Twelve participants were tested in total, six of which were music students from the University of British Columbia. Music students were selected for testing as they are deemed to be at higher-risk of noise exposure than their counterparts, as a result of regular practice and rehearsal sessions as well as performance.10,29 Five of these students were female and one was male. They played a variety of different instruments, including clarinet, oboe, soprano, trumpet, flute, and piccolo. They ranged from the ages of 18 to 27 (mean: 20 years). The low-risk noise exposure group was comprised of five females and one male, all were between the ages of 22 and 26 (mean: 24 years).
All participants were required to have no history of chronic middle ear infections and normal middle ear functions as determined by clear otoscopy results and results from immittance testing. Participants were also required to have air conduction thresholds within normal limits (<25 dB HL) at conventional testing frequencies (250 – 8000 Hz) with no conductive components. The normal hearing (NH) subjects were subjected to stricter requirements on top of those previously mentioned. They had to have no history of head trauma or concussions, no tinnitus, and no extended noise exposure (including no shooting of firearms, and no band or orchestra experience). Acoustic reflexes had to be present and otoacoustic emissions had to be present for 3 out of 5 frequencies tested (1–4 kHz) with 4 kHz being mandatory. The NH Group was also required to have normal extended high-frequency thresholds (9–16 kHz) with no asymmetrical loss, which was defined as being a 10 dB HL interaural gap between two consecutive frequencies, or a 20 dB HL interaural gap at one frequency. Prior to testing, participants were required to give their written informed consent.
Methodology
A biological check of the audiometer was completed daily, prior to testing, and calibrations of the immittance machine were conducted whenever the machine was turned on. All participants were subject to the following testing protocol. After participants completed their questionnaires, otoscopy was conducted bilaterally, followed by immittance testing. Immittance testing involved wideband acoustic immittance as well as acoustic reflexes at 0.5, 1, 2 and 4 kHz, and broadband noise (BBN). Distortion product otoacoustic emissions (DPOAEs) and transient evoked otoacoustic emissions (TEOAEs) between 1 and 4 kHz were collected as well. Sound pressure levels (SPL) were recorded in both the conventional and extended high-frequency range using a Larson Davis System 824 sound-level meter to convert all the HL values to equivalent sound-pressure levels (RETSPLs) at conventional (0.25–8 kHz) and extended high frequency (9–16 kHz). The calibration set-up used a Larson Davis PRM902 preamplifier, a Larson Davis AEC101 artificial ear, a Larson Davis one-half inch microphone” Model 2559, a flat plate attachment, and a 3.2 lb (1.5 kg) weight.
All participants filled out a case history which was acquired from Liberman et al.10 This case history was used as a screener to ensure that participants were meeting the study criteria and gave a general picture of their overall hearing health. Participants also completed the Noise Exposure Questionnaire designed by Johnson et al.30 The Noise Exposure Questionnaire was created with the purpose of collecting detailed and specific information concerning an individual’s annual noise exposure (ANE) in order to determine if a person was at high- or low-risk of noise-induced hearing loss.30 For the purpose of their study, Johnson et al. (2017) stated that if an individual had a ≥ 79 LAeq8760h (annual noise exposure [ANE] ≥ 79) they are considered to be at high risk of developing a noise-induced hearing loss (NIHL). In our study, the annual noise exposure of participants was determined using the same calculations as Johnson et al.30 Music students who also stated they had tinnitus filled out the Tinnitus Handicap Inventory available on Otosuite by OTOmetrics.
Pure-tone air conduction thresholds were obtained using Otosuite, OTOmetrics Bekesy module and a circumaural headset (HDA 200). Thresholds were obtained from 250 Hz to 16,000 Hz at octave intervals and also at 9, 10, 11.2, 12.5 and 14 kHz. Extended high frequencies were chosen to be tested as there is evidence showing that those exposed to noise have decreased hearing thresholds in the extended high frequencies before showing a loss at conventional frequencies.24,25 Testing extended high frequencies for early detection of noise-induced hearing loss has been found to be a useful tool in current research.31 Bone-conduction thresholds were acquired from 250 Hz to 4,000 Hz by placing a standard bone conduction transducer over the mastoid process of the temporal bone of the poorer ear. In both the low-risk and high-risk group, one to two air-bone gap of > 10 dB HL were acceptable as long as there were no other indications of middle ear pathology.
For the remainder of testing, circumaural headphones were worn. Threshold-in-noise (TEN) testing was conducted, as this has been found to be a good predictor of hidden hearing loss in humans when paired with other tests.1 This was followed by masking level difference testing (MLD). Abnormal performance on the MLD is consistent with brainstem disorder.27 A 69% sensitivity result for the MLD test for subjects with brainstem involvement.32 The MLD test was conducted using the AStera audiometer in a screening mode. First the masking needed to completely mask the test tone when the tone and the masking noise was in phase between both ears (SONO) was measured and then this was compared with a condition when either the tone was 180 degrees out of phase between the ears (SπNO) or the masking noise was (SπNp). The difference in MLD threshold was automatically calculated when the necessary data for the different conditions were stored. Loudness scaling was conducted to determine the dynamic range of each participant and QuickSIN was implemented to assess signal to noise ratio loss. Multiple Auditory Processing Assessment (MAPA) was administered during testing. Through MAPA all participants completed the Monaural Selective Auditory Attention Test, the Tap Test, the Pitch Perception Test, the Dichotic Digits Test, Competing Sentences Test, and the Gap in Noise Test. MAPA testing was conducted as there is evidence deeming it to be an appropriate multiple-test CAPD battery (Domitz and Show, 2000).28 Domitz and Show found that when the mSAAT, the dichotic digits test and the pitch perceptions test were used in conjunction they have a sensitivity of 90%.28 Animal research and emerging human research suggests a potential link between the effects of cumulative noise exposure and auditory processing difficulties, without a change in audiometric thresholds.14,28,33,34 If cumulative noise exposure has the potential to aggravate neural degeneration without changes in hearing detection, tests of auditory processing could be valuable in the prevention of later problems.
Results
Statistical Analysis
Two-tailed t-tests were used to test the significant differences between groups for tests with two independent variables. Two-way general linear model ANOVAs were used to compare the differences between groups for tests with more than two independent variables (Statistica, TIBCO Software).
NEQ
The total amount of noise exposure was measured using the Noise Exposure Questionnaire (NEQ). The music group showed significantly higher exposures (mean = 78.2%) than the NH group (mean = 67.8%) (p < 0.001) (Figure 1).
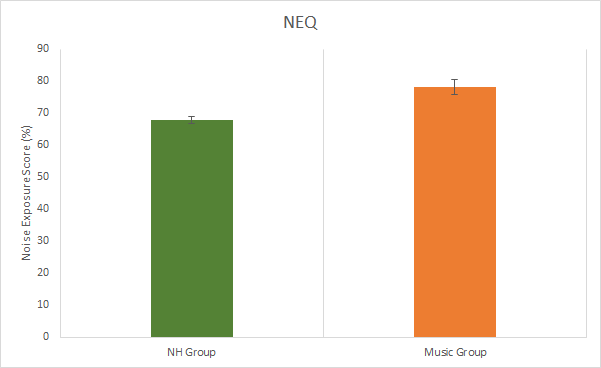
Figure 1. Results from the noise exposure questionnaire. Significant difference between groups (p < 0.05). Error bars represent standard deviations.
Audiometry and Immittance
All subjects had normal audiometric thresholds (<20 dB HL) in the conventional audiometric frequencies (250 to 8 kHz), as this was part of the inclusion criteria. Differences between group thresholds in RETSPL (for 250 Hz to 16 kHz) were evaluated using a general linear model ANOVA with normal vs. music exposed as a between-subject factor and RETSPLs across frequencies as a within-subject factor. There was no significant main effect of the group (F(15, 315), p < 0.05). However, there was a significant interaction between RETSPLs across frequencies and groups indicating that the music exposed group RETSPLs varies differently from the normal group across frequencies. A planned posthoc Bonferroni comparison was used due to a large number of comparisons.35 The posthoc analysis revealed no differences at any specific frequencies (Figure 2).
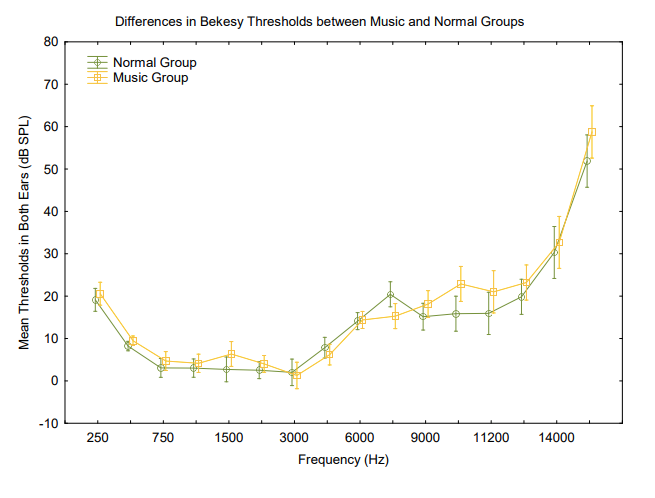
Figure 2. Differences in Bekesy thresholds across frequencies between groups. There was a significant difference between the groups F(15, 315) = 2.0251, p = 0.01349. Vertical bars denote .95 confidence intervals.
Objective immittance measures were recorded to determine the function of the middle ear. There were no significant differences between groups in terms of peak pressure and ear canal volume p > 0.05. There was a significant difference between the music group (mean = 871.33 Hz) and the NH group (mean = 1077 Hz) in the resonant frequency of the left ear (p < 0.05) (Table 1).
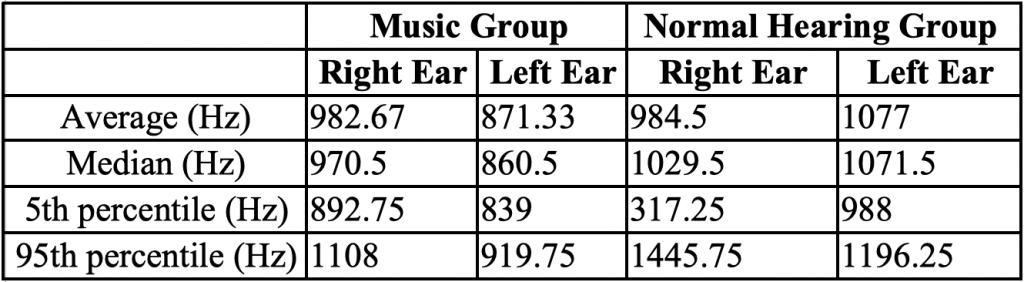
Table 1. Resonant Frequency Average, Median, 5th and 95th Percentiles in Music and Normal Hearing Groups in Each Ear Acoustic reflex thresholds were obtained using broadband noise to determine normal stapedial reflex pathways. There were no significant differences between groups (p > 0.05), although one music student did not have a reflex in one ear with a stimulus level at the maximum tested of 100 dB (Table 2 and Figure 3).
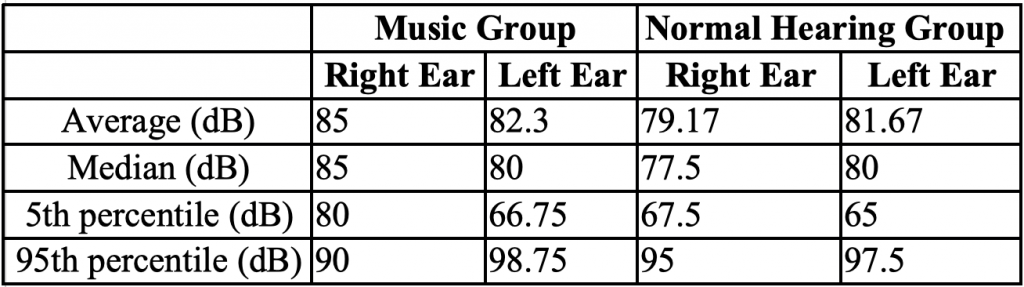
Table 2. BBN Acoustic Reflex Results Average, Median, 5th and 95th Percentiles in Music and Normal Hearing Groups for Each Ear
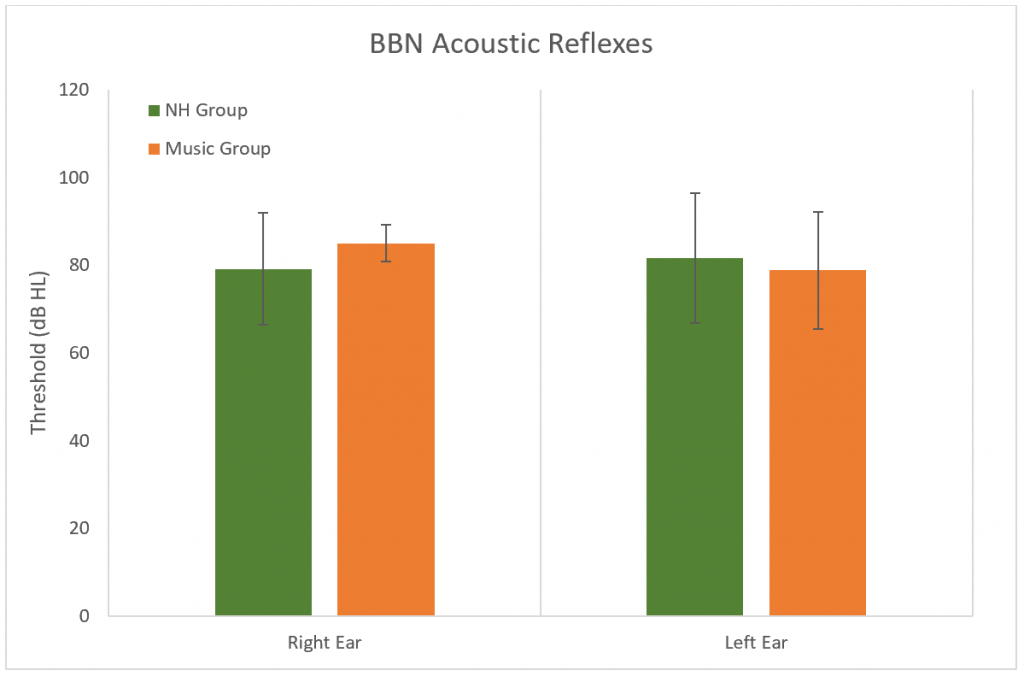
Figure 3. Results of the broadband acoustic reflex thresholds. No significant difference between groups (p > 0.05). Error bars represent standard deviations.
Outer hair cell function was evaluated using distortion product and transient evoked otoacoustic emissions (DPOAEs and TEOAEs). Amplitudes (Figures 4 and 5) and noise floors for both DPOAEs and TEOAEs were not significantly different between groups using a general linear model ANOVA (p > 0.05).
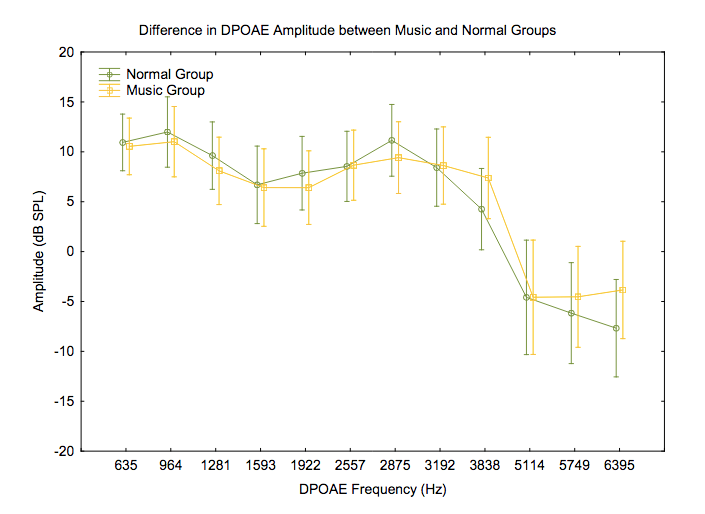
Figure 4. Differences in DPOAE amplitudes across frequencies between groups. F(11, 231) = .68717, p = .75022. Vertical bars denote .95 confidence intervals.
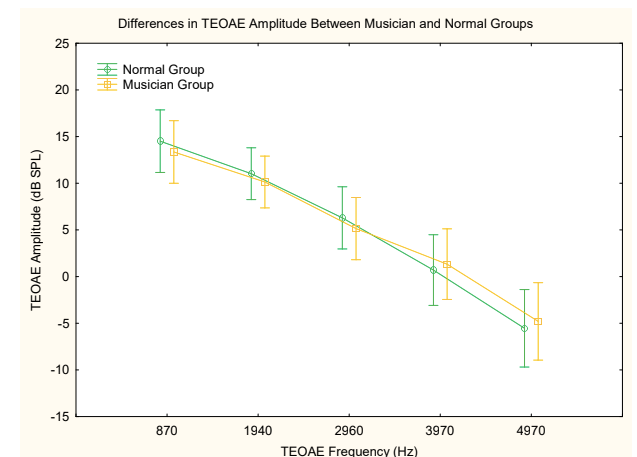
Figure 5. Differences in TEOAE amplitudes across frequencies between groups. F(4, 84) = .53771, p = .70840. Vertical bars denote .95 confidence intervals.
Central Auditory Processing
The Threshold-Equalizing Noise (TEN) test was used to determine thresholds in noise at 1 kHz (Figure 6) and at 4 kHz (Figure 7). No significant difference was found between groups at either frequency (p > 0.05).
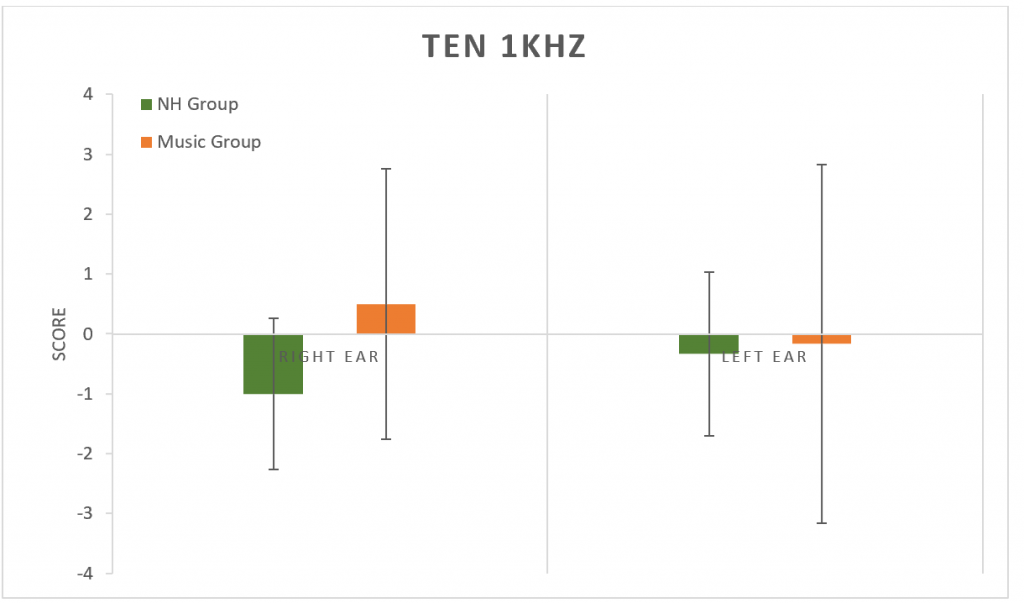
Figure 6. Results from the TEN test at 1 kHz. No significant difference between groups (p > 0.05). Error bars represent standard deviations.
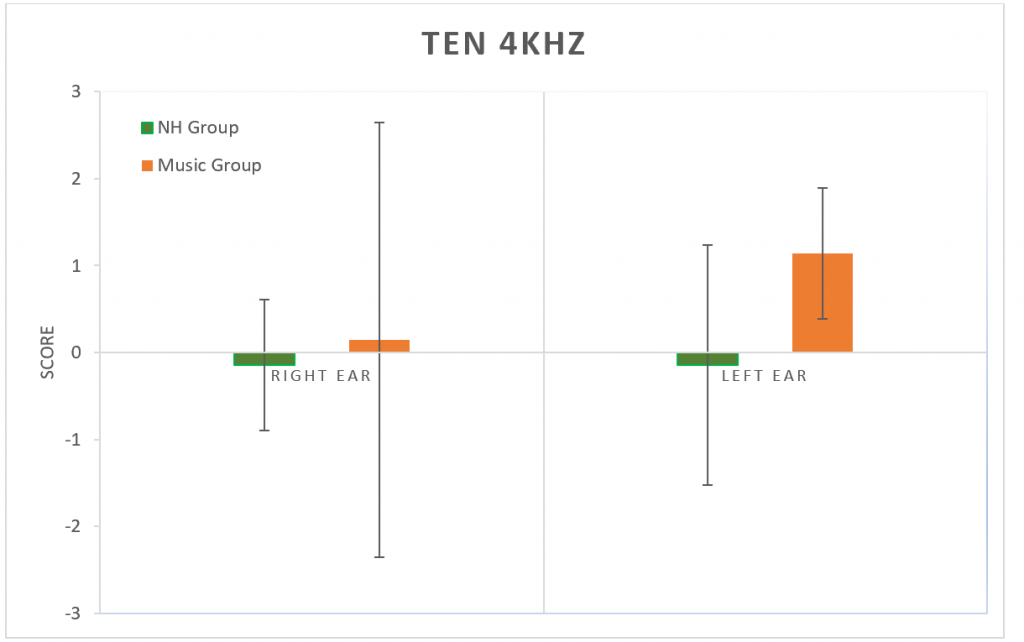
Figure 7. Results from the TEN test at 4 kHz. No significant difference between groups (p > 0.05). Error bars represent standard deviations.
The Masking Level Difference (MLD) test was used to determine the release of masking abilities to a 500 Hz tone. No significant difference was found between groups (p > 0.05) for changes in either SπNO (signal) or SONπ (Noise) conditions. (Figure 8).
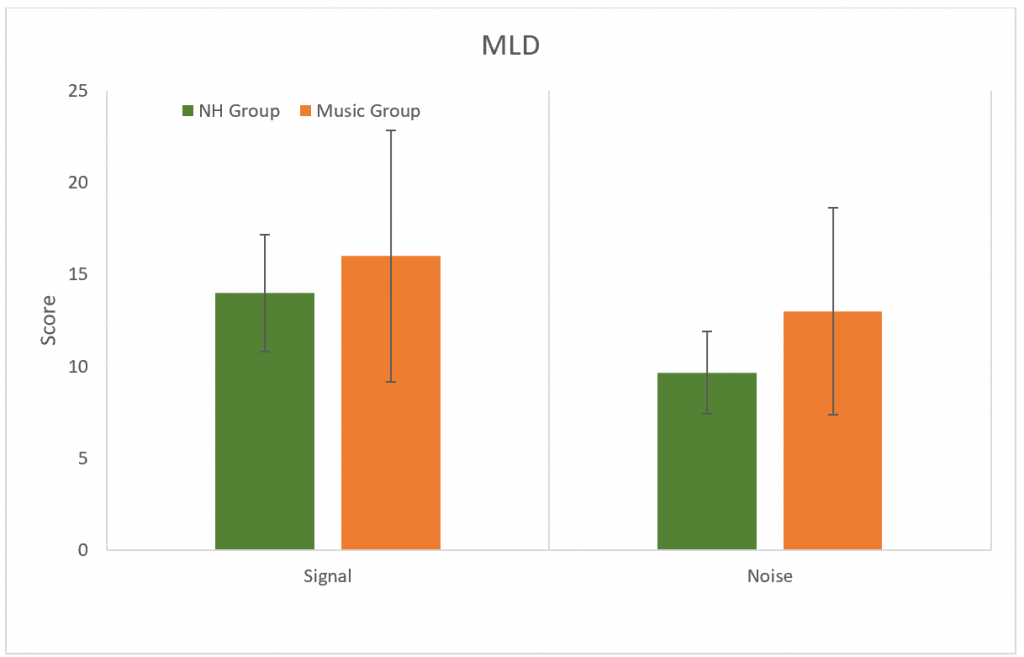
Figure 8. Results for the MLD test for SπNO (signal) and SONπ (Noise) conditions. No significant difference between groups (p > 0.05). Error bars represent standard deviations.
Loudness scaling was used to determine dynamic ranges. No differences were found between groups in either ear (p > 0.05) (Figure 9)
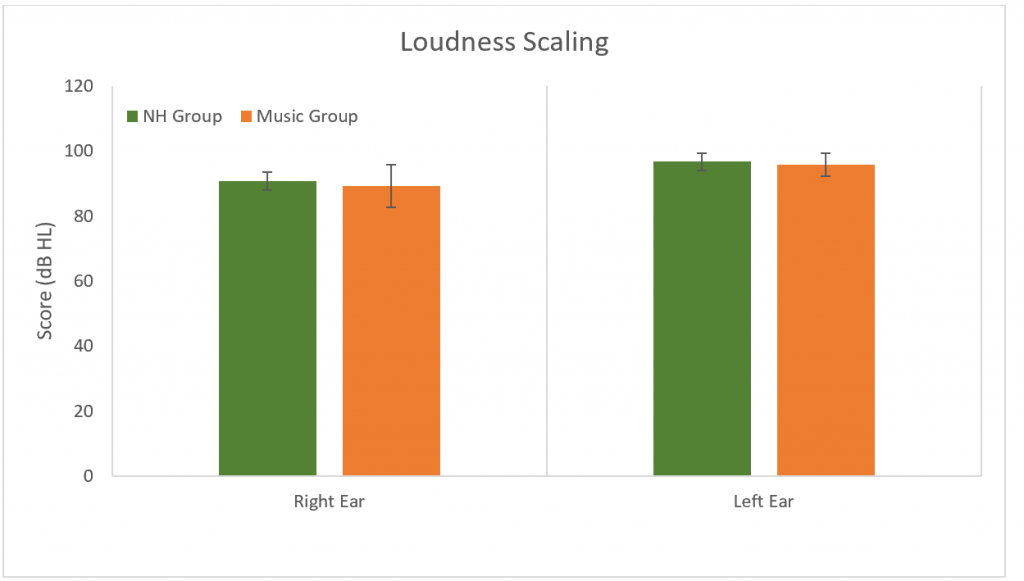
Figure 9. Results for the loudness scaling. No significant difference between groups (p > 0.05). Error bars represent standard deviations.
QuickSIN was used to determine SNR loss. No differences were found between groups in either ear or binaurally (p > 0.05) (Figure 10).
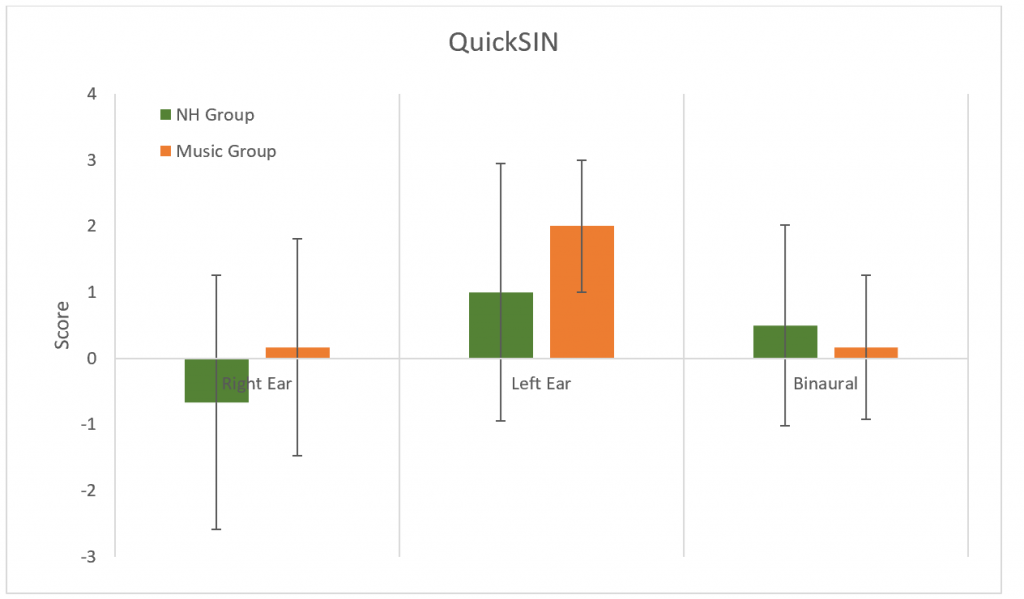
Figure 10. Results for the QuickSIN. No significant difference between groups (p > 0.05). Error bars represent standard deviations.
The Multiple Auditory Processing Assessment (MAPA) is a test battery used to identify auditory processing disorder. It contains tests of monaural (MSAAT-NC and MSAAT-C, temporal, Pitch Perception Test, and Gap in Noise test, and binaural processing (Dichotic Digits and Competing Sentences. There were no differences between groups for any of the MAPA tests (p > 0.05). For the non-competing MSAAT, all participants reached the ceiling.
Discussion
Significant differences between the NH Group and Music Group were found for the NEQ and the resonant frequency of the left ear. The interaction between groups and RETSPLs across frequencies was also significant. No significant differences between groups were found for: TEN at 1000 Hz and 4000 Hz, MLD, loudness scaling, QuickSIN, all MAPA subtests, ear canal volume, tympanometric peak pressure, BBN acoustic reflex thresholds, DPOAE, and TEOAE amplitudes.
NEQ
As expected, we found a significant difference in the mean annual noise exposure (ANE) between the NH Group and the Music Group. The question that contributed most to the difference in mean was question 7: “How often did you play a musical instrument (in the past year?).”30 As we recruited subjects from the music department at the University of British Columbia, all of the Music Group were current music students who practice their instrument every day. This supports our assumption that the Music Group represents a high-risk for noise exposure population and that the NEQ developed by Johnson et al. was sensitive to the difference.30
However, the NEQ was limited in its ability to describe the subjects’ lifetime exposure to noise. From casual conversations with the subjects from NH Group, we noticed that some of the participants were active in a band or played an instrument at an earlier time in their life. This was not taken into account by the NEQ because the questionnaire only sampled activities within the last year from the time of administration. Thus, even though our NH Group may have a lower mean ANE from the Music Group, the NEQ may have underestimated their lifetime exposure to noise. This may explain the lack of significant differences as measured by the other behavioural tests. A future direction would be to use a questionnaire that sampled the lifetime history of noise exposure to more accurately capture potential damage to the cochlea.
Audiometry and Immittance
Significant differences were found in the interaction between RETSPL thresholds across frequencies (250–16K Hz) and the Music Group and NH Group; however, no significant differences were observed at any individual frequencies between the two groups using a posthoc analysis. In their study, Liberman et al. found a significant difference in thresholds between the high-risk and low-risk groups for noise exposure.10 Other studies have also shown that noise exposure can cause an elevation in extending high frequency (EHF) thresholds before conventional frequencies are affected.24,25 As well, in their study comparing the thresholds of music students to normal hearing participants, Lüders and Conto found that thresholds at 9K, 10K, and 11.2K Hz were elevated in both ears for the former group.31 Our data does show a slight elevation in thresholds for the music students in the range of 9 to 11.2K Hz, which might have been significant if our sample size was larger.
Immittance testing was expected to have no significant difference between the groups as each participant was required to have a normal middle ear function as part of the inclusion criteria. The BBN acoustic reflexes were also expected to be normal if there was no underlying middle ear dysfunction or sensorineural hearing loss. The only truly significant difference was found in the resonant frequency of the left tympanic membrane of the Music Group, which was higher than the NH Group. A high resonant frequency is known to be caused by certain middle ear pathologies such as otosclerosis.36 To the best of our knowledge, there is no literature that correlates a higher resonant frequency with excessive noise exposure, and this finding in our study needs to be further investigated in a larger sample size.
Although there is no significant difference in the BBN acoustic reflex thresholds between the groups, a trend is noted. The average dB of the reflexes of the Music Group were higher than the NH Group in both ears (right ear = 3.33 dB higher, left ear = 0.63 dB higher). Also, subjects from the Music Group who ranked in the 5th percentile had a right BBN acoustic reflex at 80 dB compared to 67.5 dB for the NH group. As low spontaneous rate fibers are part of the acoustic reflex pathway37 it could be predicted that if synapses are damaged at these sites, then acoustic reflex thresholds would be slightly elevated in those with a hidden hearing loss. This may be observed in a future study with larger sample size. This study did not measure the growth of the acoustic reflex over increasing high levels. A recent study observed a weak growth of the acoustic reflex in individuals who had noise-induced tinnitus and normal/near normal hearing thresholds.37 Similar findings were observed in mice with excessive noise exposure and confirmed cochlear synaptopathy.38 This measurement could be included in future studies to develop an appropriate test battery for hidden hearing loss.
Otoacoustic emissions testing is a non-invasive objective way to measure the function of the outer hair cells.39,40 Detection of OAE’s is an important part of this study’s test battery as the outer hair cells are found to be intact in hidden hearing loss. However, previous studies have examined the ability of OAE’s to detect temporary noise-induced hearing loss via their change in amplitudes due to noise exposure. Korres et al. observed decreased amplitudes of DPOAEs at 2–5 KHz after exposure to noise, which was reversed after recovery time.41 In our study, there was no significant difference between the groups’ DPOAE and TEOAE amplitudes. A reason for this may be due to our small sample size and the fact that the Music Group may not have been exposed to noise recently enough (less than 24 hours) for a temporary noise-induced hearing loss to be detected by OAE’s or PTA.
Central Auditory Processing
The TEN test can be used to evaluate thresholds in noise, as well as identify the presence of cochlear dead regions, which are thought to be present if the TEN masking noise resulted in a change of threshold greater than 10 dB HL.42 There was no significant difference found between the TEN scores for the NH Group or the Music Group. While the cochlear dead regions typically exist in people who have at least a moderate to moderately-severe sensorineural hearing loss in the low or high frequencies (Moore, 2004; Moore, 2001)43,44; however, Ridley et al. have recently reported that measures of the threshold in noise may be useful in predicting HHL.1
No significant differences were found between groups for the release of masking levels. MLD is a test of binaural listening and the processes that underlie the integration of timing, lateralization, and localization of the acoustic stimuli.32,45 It is sensitive to brainstem lesions but only a limited number of research studies have examined it relative to cochlear synaptopathy.27 We hypothesized that the increased difficulty with listening in noise in subjects with cochlear synaptopathy could be related to a weaker integration of binaural temporal and amplitude cues. However, the MLD differences were not significant which may be due to the use of a screening version of the test and small sample size.
Loudness scaling demonstrates the change in a listener’s perception of loudness with increasing intensity of the stimulus. It has been shown to relate to an individual’s audiogram with normal hearing listeners demonstrating a more subtle increase in perception of loudness at low to moderate level stimuli, and a steeper increase in perception at high intensities. Those with sensorineural hearing loss typically exhibit quickly steepening loudness scaling curves. Our results demonstrated no significant differences between the NH and Music Group, as would be predicted based on their similar audiograms.46 Sanchez, et al stated that “tinnitus and reduced sound level tolerance (SLT) are early indications of a vulnerability to possible hidden synaptic injury that is prevalent among adolescents and expressed following exposure to high-level environmental sounds.”47,48 Little is currently known about loudness scaling in the HHL and further research needs to be conducted in order to evaluate this categorical measure in different populations.
HHL is believed to affect low spontaneous rate fibers that are responsible for the coding of stimuli in the presence of background noise.17 In order to test hearing ability in the presence of background noise, the results of QuickSin tests were compared between groups. Studies have shown positive correlations between subjects with high risk of cochlear synaptopathy (the potential source of HHL) and poorer abilities to recognize words in noise.10 Other studies have shown an opposing perspective, with no significant differences between speech in noise scores and noise exposure. In a study by Smith et al49 with 194 participants, QuickSin scores were extremely similar for both the noise exposure group and the control group who both demonstrated normal audiograms. The results of our study might be explained due to noise-exposure-induced HHL not presenting itself as poorer speech in noise perception. In one study by Guest et al no correlation was found between self-reported noise exposure and those who reported speech in noise perception difficulties with otherwise normal pure tone audiograms.50 This research suggests that hidden hearing loss related to noise exposure does not certainly degrade the perception of speech in noise. Other studies have shown a positive correlation between lifelong musical experience and better perception of speech in noise in both young and older adults.34,50 Perhaps it is possible then that this might offset the potential decreases in a speech in noise perception that could occur as a result of music-related noise exposure. This might also explain the similar results seen between both the NH and Music groups in our study. Interestingly, a study by Skoe et al, showed that noise exposure might dominate when it comes to the opposing effects of musical experience and noise exposure on speech in noise perception.51 In this study, 56 college students with normal thresholds in conventionally tested frequencies with musical experience were examined. QuickSin scores were higher for those with more years of musical practice and lower for those with greater degrees of noise exposure, but when considered altogether, noise exposure triumphed, overpowering the increases of speech in noise perception due to the musical experience. Lastly, the aforementioned study by Liberman that demonstrated poorer recognition of words in noise in high risk individuals utilized a much larger sample size of 22, therefore our smaller sample size may account for the absence of any significant difference between groups.52
Many researchers believe that the most probable reason for HHL is deficits in central auditory processing.5 Additionally, both the aging populations and noise-exposed individuals that are commonly associated with hidden hearing loss have demonstrated difficulties with speech perception, especially in noise, while having normal conventionally-tested thresholds.53 These difficulties with speech perception have been speculated to be the result of deficits in temporal processing, a component of central auditory processing.12 To test for central auditory processing deficits, the MAPA was utilized, which includes subtests in the temporal processing domain.28 Gallun et al conducted a study evaluating the results of several central auditory processing tests administered to a population of 36 individuals with normal conventional hearing thresholds who had been previously exposed to blast noise.52 Blast-exposed individuals performed significantly worse than controls on the Gaps-in-Noise (GIN) gap detection test.54 In this same study, dichotic digit test scores were similar, demonstrating similar binaural integration abilities between the two groups. In another study by Nelson, Wilson, and Kornhass there were no significant differences demonstrated on the dichotic digits test between the Music (n=24) and NH groups (n=24).33
In our study, none of the results for the MAPA subtests were significant. This might be due to the small sample size used in this study. In the study mentioned previously by Gallun et al,54 the Gaps-in-Noise test may have demonstrated significant results due to the larger sample size of 36 individuals, or the difference in noise exposure type, blast exposure, as opposed to music exposure. The subtests of the MAPA test battery including the dichotic digits test and the pitch pattern test have demonstrated sensitivity to aspects of central auditory processing disorders in other populations such as those with neurological disorders or brain injury.5,55 Another reason for the results of this study might be that the MAPA subtests were not sensitive enough to the diminished levels of temporal processing deficits due to noise exposure, as they are with deficits as a result of neurological injuries/disorders. Although MAPA tests various aspects of central auditory processing, additional tests could be employed to examine a greater scope of central auditory processing and its potential connections with hidden hearing loss.
Conclusion
In our study, we did not find any significant differences between NH and Music Groups beyond the mean ANE as measured by the NEQ and a significant interaction between RETSPLs across frequencies and the groups. A limitation of our experiment was the small sample size. We recruited and tested 6 music students and 6 individuals with self-report of no noise exposure. There were some tests which showed a trend and which might have been significant if our sample size was larger.
In addition, we focused on a population whose high noise exposure was due to playing and listening to music. It is possible that the type of noise exposure could have influenced the lack of significant results that were found for the majority of tests. Furthermore, the NEQ was limited to self-report of activities done within the last year. It is possible that our NH Group and Music Group has a similar lifetime exposure to noise, which could explain the inconclusive results for the other tests. Future directions would be to include a bigger sample size and use a questionnaire sensitive to the noise exposure within a lifetime combined with an array of electrophysiological assessments.
References
- Ridley CL, Kopun JG, Neely ST, et al. Using thresholds in noise to identify hidden hearing loss in humans. Ear Hear 2018;39(5):829–44.
- Lobarinas E, Salvi R, and Ding D. Insensitivity of the audiogram to carboplatin induced inner hair cell loss in chinchillas. Hearing research 2013;302:113–20.
- Schaette R and McAlpine D. Tinnitus with a normal audiogram: physiological evidence for hidden hearing loss and computational model. J Neurosci 2011;31(38):13452–57.
- Wan G and Corfas G. Transient auditory nerve demyelination as a new mechanism for hidden hearing loss. Nat communicat 2017;8:14487.
- Musiek FE, Chermak GD, Bamiou DE, Shinn J. CAPD: The Most Common ‘Hidden Hearing Loss’: Central auditory processing disorder—and not cochlear synaptopathy—is the most likely source of difficulty understanding speech in noise (despite normal audiograms). The ASHA Leader 2018;23(3):6–9.
- Hind SE, Haines-Bazrafshan R, Benton CL, et al. Prevalence of clinical referrals having hearing thresholds within normal limits. Int J Audiol 2011;50(10):708–16.
- Alvord LS. Cochlear dysfunction in" normal-hearing" patients with history of noise exposure. Ear Hear 1983;4(5):247–50.
- Kumar U, Ameenudin S and Sangamanatha A. Temporal and speech processing skills in normal hearing individuals exposed to occupational noise. Noise Health 2012;14(58):100–100.
- Stamper GC and Johnson TA. Auditory function in normal-hearing, noise-exposed human ears. Ear Hear 2015;36(2):172.
- Liberman MC, Epstein MJ, Cleveland SS, et al. Toward a differential diagnosis of hidden hearing loss in humans. PloSOne 2016;11(9):e0162726.
- Ruggles D, Bharadwaj H, and Shinn-Cunningham BG. Why middle-aged listeners have trouble hearing in everyday settings. Curr Biol 2012;22(15):1417–22.
- Snell KB, Mapes FM, Hickman ED, and Frisina DR. Word recognition in competing babble and the effects of age, temporal processing, and absolute sensitivity. J Acoust Soc Am 2002;112(2):720–27.
- Furman AC, Kujawa SG, and Liberman MC. Noise-induced cochlear neuropathy is selective for fibers with low spontaneous rates. J Neurophysiol 2013;110(3):577–86.
- Kujawa SG and Liberman MC. Adding insult to injury: cochlear nerve degeneration after “temporary” noise-induced hearing loss. J Neurosci 2009;29(45):14077–85.
- Sergeyenko Y, Lall K, Liberman MC, and Kujawa SG. Age-related cochlear synaptopathy: an early-onset contributor to auditory functional decline. J Neurosci 2013;33(34):13686–94.
- Lin HW, Furman AC, Kujawa SG, and Liberman MC. Primary neural degeneration in the Guinea pig cochlea after reversible noise-induced threshold shift. J Assoc Res Otolaryngol 2011;12(5):605–16.
- Kujawa SG and Liberman MC. Synaptopathy in the noise-exposed and aging cochlea: Primary neural degeneration in acquired sensorineural hearing loss. Hear Res 2015;330(Pt B):191–99. doi:10.1016/j.heares.2015.02.009
- Costalupes JA, Young ED, and Gibson DJ. Effects of continuous noise backgrounds on rate response of auditory nerve fibers in cat. J Neurophysiol 1984;51(6):1326–44.
- Beattie RC. Interaction of click polarity, stimulus level, and repetition rate on the auditory brainstem response. Scand Audiol 1988;17(2):99–109.
- Lauter JL and Loomis RL. Individual differences in auditory electric responses: comparisons of between-subject and within-subject variability II. Amplitude of brainstem vertex-positive peaks. Scand Audiol 1988;17(2):87–92.
- Mitchell C, Phillips DS, and Trune DR. Variables affecting the auditory brainstem response: audiogram, age, gender and head size. Hear Res 1989;40(1-2):75–85.
- Prendergast G, Millman RE, Guest H, et al. Effects of noise exposure on young adults with normal audiograms II: Behavioral measures. Hear Res 2017;356:74–86.
- Prendergast G, Tu W, Guest H, et al. Supra-threshold auditory brainstem response amplitudes in humans: Test-retest reliability, electrode montage and noise exposure. Hear Res 2018;364:38–47.
- Lopes AC, Otubo KA, Basso TC, et al. Occupational hearing loss: tonal audiometry x high frequencies audiometry. Int Arch Otorhinolaryngol 2009;13(3):293–99.
- Kumar P, Upadhyay P, Kumar A, et al. Extended high frequency audiometry in users of personal listening devices. Am J Otolaryngol Head Neck Med Surg 2016;38(2):163–67. doi:10.1016/j.amjoto.2016.12.002
- Duncan KR and Aarts NL. A comparison of the HINT and QuickSIN Tests. J Speech Lang Path Audiol 2006;30(2):86.
- Hannley M, Jerger JF, and Rivera VM. Relationships among auditory brain stem responses, masking level differences and the acoustic reflex in multiple sclerosis. Audiology 1983;22(1):20–33.
- Domitz DM and Schow RL. A new CAPD battery—multiple auditory processing assessment: factor analysis and comparisons with SCAN. Am J Audiol 2000;9(2):101–11.
- Washnik NJ, Phillips SL, and Teglas S. Student's music exposure: Full-day personal dose measurements. Noise Health 2016;18(81):98.
- Johnson TA, Cooper S, Stamper GC, and Chertoff M. Noise Exposure Questionnaire: A tool for quantifying annual noise exposure. J Am Acad Audiol 2017;28(1):14–35.
- Gonçalves L, Giglio de Oliveira C, Bender A et al. Music students: Conventional hearing thresholds and at high frequencies. Braz J Otorhinolaryngol 2014;80(4):296–304. doi:10.1016/j.bjorl.2014.05.010
- Brown M and Musiek F. Pathways: The fundamentals of masking level differences for assessing auditory function. Hear J 2013;66(1):16–17.
- Nelson DM, Wilson RH and Kornhass S. Performance of musicians and nonmusicians on dichotic chords, dichotic CVs, and dichotic digits. J Am Acad Audiol 2003;14(10):536–44.
- Parbery-Clark, A, Strait DL, Anderson S, Hittner E, and Kraus N. Musical experience and the aging auditory system: implications for cognitive abilities and hearing speech in noise. PloSOne 2011;6(5):e18082.
- Salkind NJ. Encyclopedia of research design Thousand Oaks, CA: SAGE Publications, Inc; 2010.
- Shahnaz N and Polka L. Standard and multifrequency tympanometry in normal and otosclerotic ears. Ear Hearing 1997;18(4):326–41.
- Wojtczak M, Beim JA, and Oxenham AJ. Weak middle-ear-muscle reflex in humans with noise-induced tinnitus and normal hearing may reflect cochlear synaptopathy. ENeuro 2017;1–26.
- Valero MD, Hancock KE, Liberman MC. The middle ear muscle reflex in the diagnosis of cochlear neuropathy. Hear Res 2016;(332):29–38.
- Kobler JB, Guinan JJ Jr, Vacher SR, Norris BE Acoustic reflex frequency selectivity in single stapedius motoneurons of the cat. J Neurophysiol 1992;(68)807–17.
- Kemp DT. Stimulated acoustic emissions from within the human auditory system. J Acoust Soc Am 1978;1386–91.
- Korres GS, Balatsouras DG, Tzagaroulakis A, Kandiloros D, Ferekidou E, Korres S. Distortion product otoacoustic emissions in an industrial setting. Noise Health 2009;11(43):103–10
- Moore BCJ, Glasberg BR, and Stone MA. New version of the TEN test with calibrations in dB HL. Ear Hear 2004;25(5):478–87. doi:10.1097/01.aud.0000145992.31135.89
- Moore BCJ. Dead regions in the cochlea: Diagnosis, perceptual consequences, and implications for the fitting of hearing aids. Trends Amplificat 2001;5(1):1–34. doi:10.1177/108471380100500102
- Moore BCJ. Dead regions in the cochlea: Conceptual foundations, diagnosis, and clinical applications. Ear Hear 2004;25(2):98–116. doi:10.1097/01.AUD.0000120359.49711.D7
- Johnson ML, Bellis TJ, and Billiet C. Audiological assessment of (C)APD. In: DS. Geffner and D. Ross-Swain (Eds.), Auditory Processing Disorders: Assessment, Management, and Treatment. San Diego, CA: Plural; 2007.
- Al-Salim SC, Kopun JG, Neely ST et al. Reliability of categorical loudness scaling and its relation to threshold. Ear Hear 2010;31(4):567.
- Sanchez TG, Moraes F, Casseb J, et al. Tinnitus is associated with reduced sound level tolerance in adolescents with normal audiograms and otoacoustic emissions. Scientif Rep 2016;6:27109.
- Parbery-Clark A, Skoe E, Kraus N. Musical experience limits the degradative effects of background noise on the neural processing of sound. J Neurosci 2009;29:14100–107.
- Smith SB, Krizman J, Liu C, et al. Investigating peripheral sources of speech-in-noise variability in listeners with normal audiograms. J Hear Res 2019 Jan;371:66–74. doi: 10.1016/j.heares.2018.11.008.
- Guest H, Munro KJ, Prendergast G, et al. Impaired speech perception in noise with a normal audiogram: No evidence for cochlear synaptopathy and no relation to lifetime noise exposure. Hear Res 2018;364:142–51.
- Skoe E, Camera S, and Tufts J. Noise exposure may diminish the musician advantage for perceiving speech in noise. Ear Hear 2018 Oct 17. doi: 10.1097/AUD.0000000000000665. [Epub ahead of print]
- Liberman MC and Kujawa SG. Cochlear synaptopathy in acquired sensorineural hearing loss: manifestations and mechanisms. Hear Res 2017;349:138–47.
- Rajan R and Cainer KE. Ageing without hearing loss or cognitive impairment causes a decrease in speech intelligibility only in informational maskers. Neuroscience 2008;154(2):784–95.
- Gallun FJ, Diedesch AC, Kubli LR, et al. Performance on tests of central auditory processing by individuals exposed to high-intensity blasts. Walter Reed National Military Medical Center. Bethesda, MD 2012.
- Hurley R and Musiek F. Effectiveness of three central auditory processing (CAP) tests in identifying cerebral lesions. J Am Acad Audiol 1997;8:257–62.