How Accurate Are These Smartphone Sound Measurement Apps?

Sound is the sensation that you can hear; it is the vibrations that are transmitted through a medium that can be detected by human organs of hearing. Noise is defined as unwanted sound, and can often be loud or unpleasant. The difference between sound and noise depends on the individual characteristics of the listener and the circumstances surrounding them. There are many sources of environmental noise in daily life and often listeners are unaware of the loudness level and whether or not their auditory system is at risk for irreversible damage.
The World Health Organization (WHO) estimates that approximately five percent of the working population (360 million people) have a disabling hearing loss.1 In addition, the WHO estimates that by the year 2050, over 900 million people will have disabling hearing loss, with 1.1 billion young people (between the ages of 12-35) being at risk for hearing loss due to recreational noise exposure.2 For example, noise from a concert, our personal listening devices, machinery, sporting events, and transportation can be potentially hazardous, and the duration in which one is exposed to this noise needs to be monitored. Therefore, identification of harmful sound levels and the resulting safety steps the listener implements (i.e., using hearing protection, reducing the sound level, increasing the distance from the sound source, and limiting exposure to the sound) are vital for hearing health. “Understanding and minimizing the risks associated with noise exposures are the keys to preventing noise-related hearing loss.”1
Historically, the gold standard equipment for measuring sound level over time is the sound level meter (SLM) and a wearable dosimeter. However, for the average person in a recreational environment, these tools are not readily available. Alternatively, sound level measurement applications accessible by smartphones are available. Research by GlobalWebIndex showed that from 32 countries, 80% of internet users have a smartphone; 54% being Android, 16% with iOS and others using alternative operating systems such as Windows.3 With the development of smartphone technology advancing rapidly every year, smartphones may be capable of replacing SLMs soon.
Smartphones have the advantage of relatively good electret condenser microphones, which are similar to those used in sound measurement devices, showing “frequency response, power requirements, and environmental/electromagnetic specifications.”1 In addition, smartphones have digital circuitry and computational capabilities that are far more advanced than a SLM in terms of power, speed, and storage capability. They are more economical in terms of usage in measuring, as compared to a larger, bulkier SLM instrument. Furthermore, smartphones are more useful as they are constantly connected to a network and have a built-in global positioning system-GPS.1
Few studies have looked at measuring sound in multiple different environments and using smartphone applications for measuring environmental noise.4 Murphy and King tested 100 phones to measure noise levels using seven different smartphone manufacturers (18 Android and seven iOS models) with a variety of applications from both Android and iOS platforms.3They wanted to identify statistically significant differences in the ability of different smartphone models to measure noise accurately and assess the suitability of the apps themselves.3 They concluded that this helps to provide a more accurate representation of smartphone devices used in the general population - in terms of age and type of phone. Their findings suggested that noise applications should not replace SLMs as of yet, but with technology advancement, the noise apps could play a large role in measuring environmental noise in the future. One drawback noted from this study was that more than one application had measured values below reference levels, therefore underestimating the true sound level. From a public health perspective, application measurements should err on the side of having noise levels slightly above those of a SLM, so that the public can be properly protected in terms of noise exposure.
In addition, a study by Kardous and Shaw looked at the accuracy of ten iOS and four Android apps in measuring noise in occupational settings with eight smartphones and one tablet.1 They concluded that the iOS smartphones were worthy of being devices to assess the noise in occupational settings, but the Android interface was not adequate due to the fact it was built by multiple manufacturers, which caused a lack of conformity in microphones and other audio components. It should be noted that this study was limited in scope as only three iPhone models and five Android devices were used.
Having noise measurement applications available on smartphones to measure environmental noise is an effective way of making people more aware of the levels of noise in their environment, and to inform them of the effects that noise can have on their hearing, as well as working to improve how we monitor sound in environments by involving citizens in these measurements.1
This paper is concerned with comparing the accuracy of sound level smartphone applications from both Android and iOS devices to the recordings from a SLM in the following environments: a living room, a classroom, a restaurant, a nightclub, public transit (a bus and Skytrain), and a fitness class. The following apps have been selected due to their availability in either the App Store or the Google Play Store: dB X Pro, AudioTools, Audio Tool, SoundPrint, and NIOSH. Measuring environmental noise in these settings will better inform the accuracy and practicality of using smartphone applications in place of other professional sound level measurement equipment.
Methods
Equipment and Criteria
For the purpose of this study, Android and iOS mobile devices were used because of the dominance of these operating systems in the smartphone market, and their ability to run publicly available sound level measurement applications. A total of five devices were used to take measurements: two Android devices (Samsung Galaxy A8, Samsung Galaxy S8) and three iOS devices (one iPhone 7Plus, and two iPhone X). These devices were volunteered for use by the University of British Columbia Audiology second-year students conducting this study. The most common microphone used in cellphones is a MEMS (MicroElectrical-Mechanical System) microphone which is cost-effective but does not provide the same quality as a sound level meter microphone. The iOS system is very careful to allow the designer to disable the cell phone's internal compressor, but this cannot be done with Android cell phones. This is why some of the software applications such as SoundLog and the NIOSH dosimeter, currently is only available in the iOS system and not the Android.
Smartphone applications were selected based on certain criteria with occupational relevancy: (1) able to support A-weighted sound levels, (2) able to report average sound level as a numeric value (3) accessible for public use on major mobile operating system digital distribution platforms (e.g., The App Store, Google Play). An attempt was made to exclusively use applications available in both operating systems. However, only two applications satisfied this qualification—Decibel X Pro and SoundPrint. The SoundPrint application for Android was not used in this study due to its inability to provide an average sound level in a numeric value. Thus, a total of six applications were chosen, of which only two were from the same developer in different digital distribution platforms: four with the iOS operating systems, and two with the Android operating systems. All applications tested in this study met our selection criteria. The full list of applications used in this study is listed in Table 1. Applications on smartphones were not manually calibrated to simulate typical use of the application by the general public.

Table 1. Applications used for sound measurement in different environments.
| Application | Mobile Operating System | Developer | Price | Web Link |
| NIOSH Sound Level Meter version 1.1.0 | iOS | EA LAB | Free | https://apps.apple.com/ca/app/niOSh-sound-level-meter/id1096545820 |
| SoundPrint, Find A Quiet Place version 2.2.1 | iOS | Soundprint LLC | Free | https://apps.apple.com/ca/app/soundprint-find-a-quiet-place/id971189322 |
| Decibel X Pro - Sound Meter dBA, Noise Detector version 4.4.3 | Android | SkyPaw Co., Ltd | $4.99 CAD | https://play.google.com/store/apps/details?id=com.skypaw.decibel10pro&hl=en_CA |
| Decibel X Pro: dBA Noise Meter version 8.0.2 | iOS | SkyPaw Co. Ltd | $21.99 CAD | https://apps.apple.com/ca/app/decibel-x-pro-dba-noise-meter/id1257651611 |
| Audio Tool version 8.3 | Android | jjbunn | $10.99 CAD | https://play.google.com/store/apps/details?id=com.julian.apps.AudioTool&hl=en_CA |
| AudioTools version 11.1.2 | iOS | Andrew Smith | $27.99 CAD | https://apps.apple.com/ca/app/audiotools/id325307477 |
A Quest Technologies NoisePro DLX SLM fitted with a Type 1 microphone was used to verify sound pressure levels for each recording session. These values were used to compare Android and iOS application values for accuracy. The SLM was calibrated using a pistonphone to generate a precise sound pressure level of 114 dB SPL at 250 Hz before each measurement session in compliance with ISO calibration standards.5 Each of the settings was verified according to CSA Z107.56 prior to each recording session.6
Overview of Methodology
Measurements were conducted over five days in six different environments in Vancouver, British Columbia that are frequented by the general public.
Measurement Procedure
Phones were removed from cases to ensure maximum access to the microphones. To ensure consistency of measurements, the phones and SLM were held at arm’s length (one to two feet) and a shoulder height of the student as the recording position for the duration of each sample. Phones and the SLM were laid flat in the palm of the hand, screen facing up and microphone facing away from the student at a 180-degree angle. This method was chosen over Kardous and Shaw’s standardized tripod method1 in favour of Murphy and King’s method,3 as the purpose of this study is to simulate typical real-world use of the sound level measurement apps by the general public. It should be noted that the measurements were altered for some locations due to space and location limitations outlined below.
Three different samples were taken within a 45 to 90-minute period, depending on the location, further described below. Three subsequent recordings were performed for each sample, with each recording lasting one minute in duration. Each recording within a sample was then averaged together to provide a more accurate representation of each time period. The first sample was obtained at five minutes after the beginning of the event (time zero). The second sample was taken at the midway point of the event, approximately 22.5 minutes after time zero. The third sample was taken five minutes from the end of the event, approximately 40 minutes after time zero (given in this example, a time measurement period of 45 minutes).
Measurements were taken with one iPhone, one Android, and the SLM simultaneously for each trial. All three devices (iPhone, Android, and SLM) were located in the same area, at approximately the same height and azimuth in order to ensure the consistency of the measurement. Each trial consisted of a one-minute measurement including the minimum, maximum, and average sound level in dB (A) as available depending on the application used. It should be noted that not all smartphone device apps provided values for these desired measures, contributing to their limitations as sound level measurement tools. For example, the AudioTools app for iOS and Android only measured the average sound level over one minute and did not provide a minimum or maximum.
These steps were followed for each iPhone app (dB X Pro, AudioTools, SoundPrint, NIOSH), and Android app (dB X Pro, Audio Tool). The order in which the measurements were taken with each app was randomized for each measurement cycle.
Measurement locations
Living room. Measurements of 45 minutes were conducted in the afternoon (16:00 16:45) in the middle of a living room between an open window facing a busy street (one meter away) and a laptop (one meter away) playing a TV show at half volume, with the devices facing the laptop at zero degrees azimuth.
Fitness class - Spin Class. Measurements for a 7:00 spin class at half capacity (12 participants) were conducted directly behind a curtain separating the class from the lobby. The total duration of the measurements was 45 minutes. The room where the class was held had walls on three sides, and the fourth side was open to the remaining studio space (divided into two sections: one half had a curtain separating the class from the lobby, and the other half was left open). Devices were held at shoulder height facing the direction of the speakers (five meters away).
Transit
Bus. Measurements of 45 minutes were taken in a busy commuter bus standing in the middle, transitional space between cars (i.e., the ‘accordion’ of the bus) between the hours of between 17:15 and 18:00. Devices were pointed zero degrees azimuth towards the center of the accordion.
SkyTrain. Measurements of 45 minutes were taken standing in the transitional space between train cars (i.e., the accordion of the train) between the hours of 18:15 and 19:00. The train was above-ground for 90% of the journey. Devices were pointed zero degrees azimuth towards the centre of the accordion.
Classroom. Measurements of 45 minutes were obtained between 13:00-13:45 in an acoustically treated classroom, suited with acoustic tiling on the ceiling and carpeted floors, with ~50 people including students and professors. Devices were oriented towards a presenter using an FM system about four meters from the center of the room, 0-45 degrees azimuth to the speaker.
Restaurant. Measurements of 90 minutes were obtained in a large busy restaurant during peak hours. Multiple speakers were oriented towards the center of the room. Measurements were taken on the perimeter of the room, with devices directed zero degrees azimuth towards the center of the room.
Nightclub. Measurements of 45 minutes were obtained in a busy nightclub between 22:30-23:15 with multiple speakers oriented towards the center of the room. Measurements were taken from the perimeter of the dance floor, with devices directed 45 degrees azimuth of the DJ stage.
For data analysis, the difference in the mean values obtained when compared to the SLM for each collection of samples (three time points) associated with the device platform, app, and location variables were assessed. Descriptive statistics were used to determine the device platform and app performance in each location when compared to the SLM.
Results
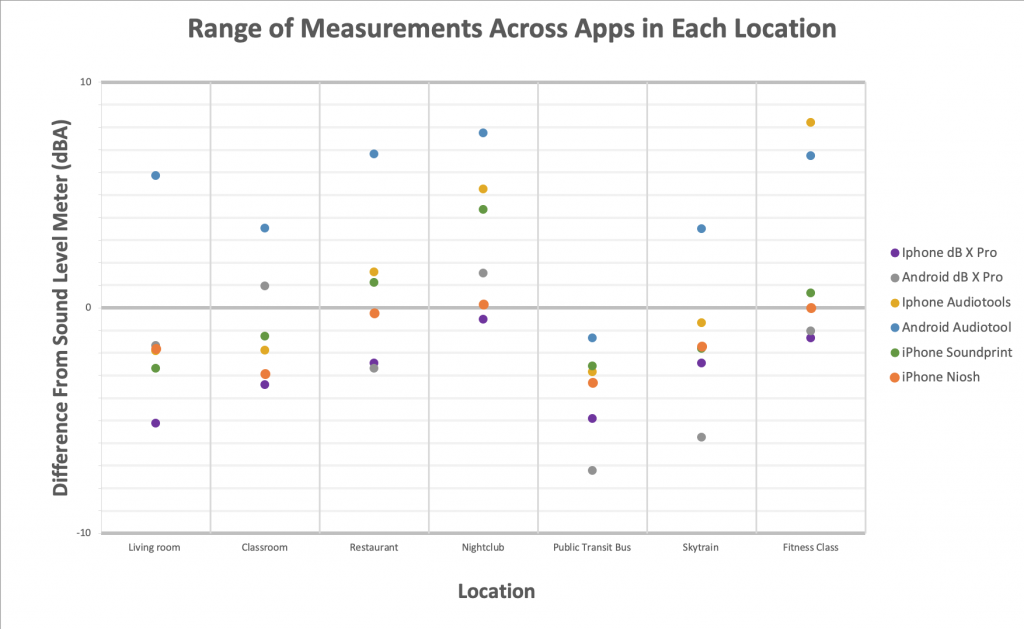
Sound level measurements were taken at three different time points in each location. At each time point, measurements were taken on the two Android apps and the four iPhone apps in succession, with the sound level meter also being used alongside each app for comparison. The three measures at each location were averaged separately for each app. The difference between the mean measurement of the app and the mean measurement of the SLM at each location is displayed on the figures below (Figures 1-6).
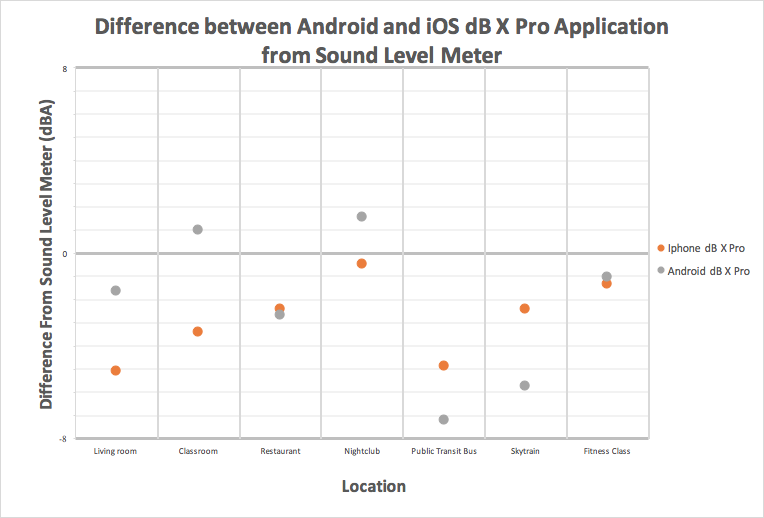
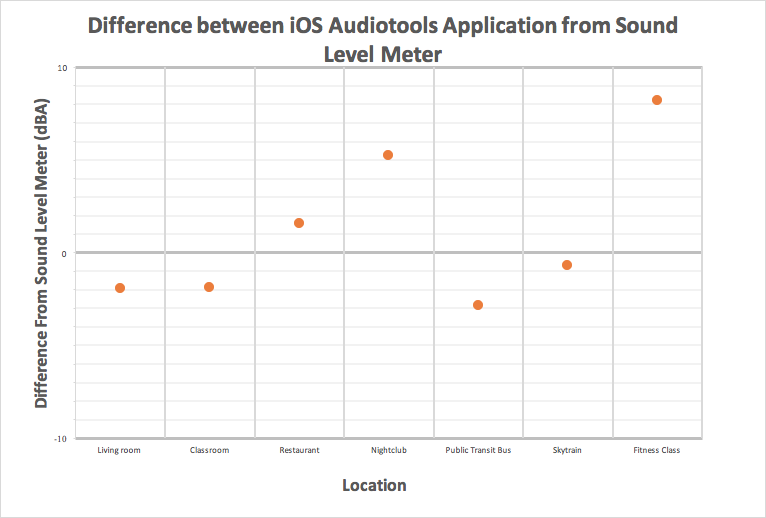
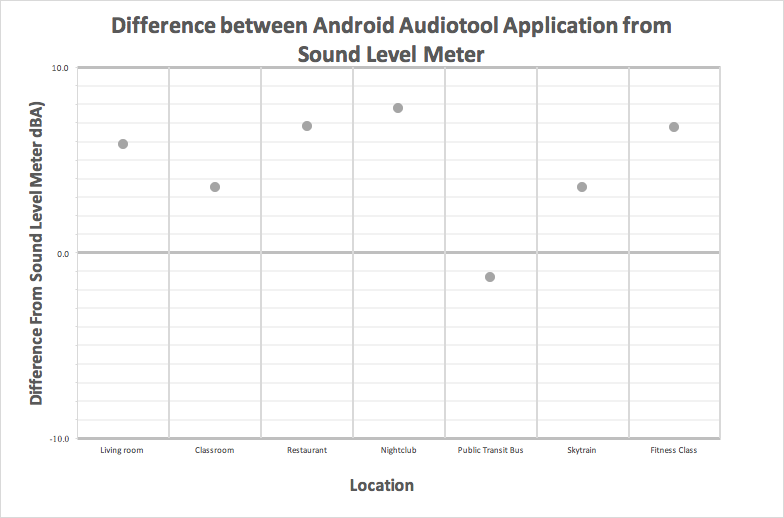
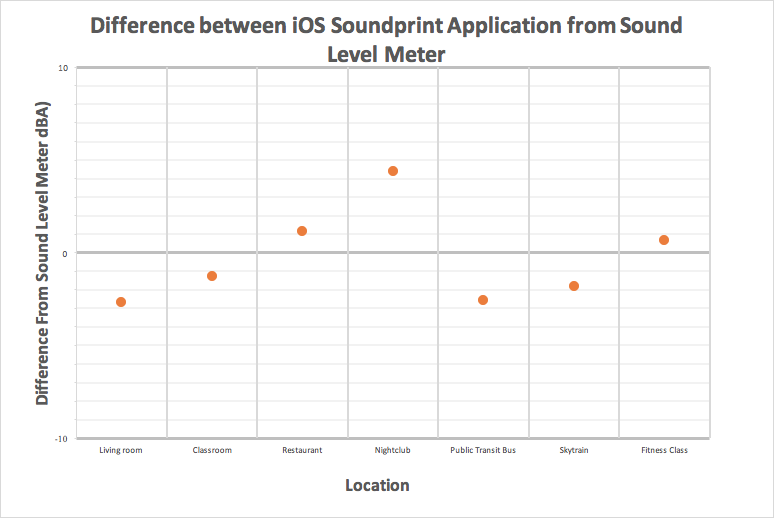
To determine the significance of the difference in means, like the majority of Canadian provinces, the exchange rate used in British Columbia (BC) for noise exposure time is 3 dB.6 This means that for any 3 dB increase in noise level above 85 dBA, the maximum permissible exposure time is cut in half. As such, we determined that any difference between the mean values greater than or equal to 3 dB is significant. Raw data tables can be found in Appendix 1.
The dB X Pro app was the only one that could be compared across platforms. The iOS version of the app had readings that were consistently below the sound level meter. The difference was only significant in the living room, the classroom, and the bus. The Android version of the app had readings significantly below the sound level meter in the bus and the Skytrain. The difference in means on the bus was more than two times the BC exchange rate.
AudioTools had a significantly higher measurement than the SLM for both the nightclub and the fitness class. The difference between the measurements at the fitness class was more than two times the exchange rate.
Audio Tool had measurements significantly higher than the sound level meters in almost all settings; only the public transit bus had a difference in means that was not significant. The difference in means at the restaurant, fitness class, and the nightclub were all more than two times the exchange rate.
The difference in means between SoundPrint and the SLM was not significant in most locations. The app measurement was only significantly higher than the SLM in the nightclub (see Figure 4).
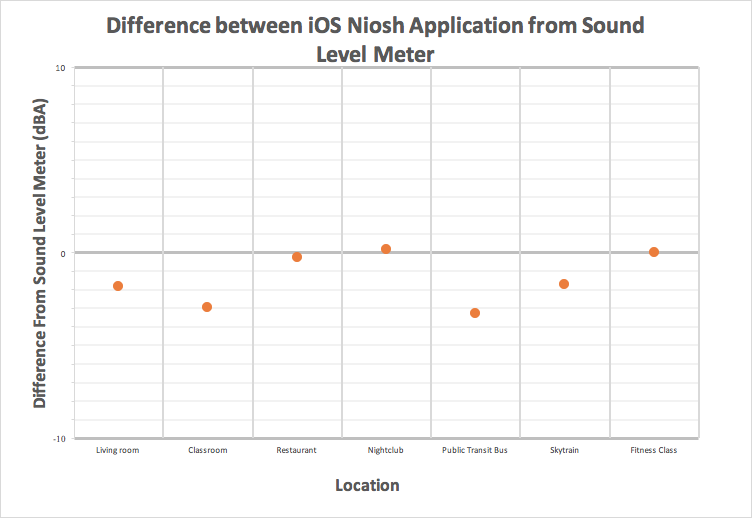
The mean measurements for the NIOSH app were not significantly different in most environments (see Figure 5). The difference in means was only significant in the bus, where the NIOSH app had a lower mean measurement than the SLM.
When looking at the range of measurements in each location, it is seen that the nightclub tended to result in above-SLM measurements across the apps, and the public transit bus tended to result in below-SLM measurements across the apps. This can be seen in Figure 6.
Discussion
The prevalence of hearing loss among adolescents has significantly increased.8 One possible cause is excessive exposure to recreational noise.9 Nightclubs in Edinburg can have sound levels up to 108 dB, which is significant enough to cause permanent damage.8 In Canada, there are provincial regulations in place to ensure employees are protected from sound overexposure, but not for individuals who attend environments such as loud restaurants or nightclubs. Awareness regarding environmental noise levels is a positive step toward addressing hearing health. A standard SLM is very cost-prohibitive for the occasional user to purchase, and is unlikely to be carried around every day. With the development of sound level meter applications for cell phones, SLMs are becoming accessible to a broader range of people, and are more likely to be utilized by the public to evaluate noisy environments they are in. The objective of the study was to assess the accuracy of smartphone sound measurement apps as well as the functionality of measuring and monitoring noise in different daily environments.
Mobile technology has provided an accessible sound level measurement that is both easy and convenient. With the increased prevalence of sound level meter app use on cell phones, it follows that more individuals are relying on these apps to determine what levels of noise are safe. The results obtained in this study show that there is a large amount of variability in the readings of cell phone applications. Because a 3 dB noise increase halves the amount of time a person can be safely exposed to the noise, variations of 3 dB or greater between apps indicate a potential hazard if the user is relying on the app to determine safe listening levels. Our results show that variations of 3 dB or greater from the SLM were common across the apps. The application most consistent with the SLM was NIOSH. The other tested applications had greater variability, with only the iOS version of dB X Pro underestimating the noise level in all test environments. All other applications were inconsistent and both over and underestimated the noise level in the different noise environments.
Nast, Speer, and Le Prell also compared measured levels of different applications for the iPhone to a SLM.10 They found an overestimation of the levels for numerous uses of some applications (i.e., SPLnFFT Noise Meter, SPL, SoundMeter, Advanced Decibel) and an underestimation for one application (dB volume). In our case, there was an overestimation or underestimation of more than 3 dB for all applications except NIOSH. Of note, their testing was done in a very controlled environment (i.e., Sound booth) with pure-tones; whereas, the current study was conducted in more realistic environment with greater spectral variability. Furthermore, the phones that were used were of different ages (ranging from 2016-2018 release dates) and therefore representative of those used by the general population. A phone's age can in turn impact the amount of microphone and circuit damage.
When using these apps, it is important to consider the rationale of the sound level measurements. When used as a tool to determine whether or not hearing protection is required or how long it is safe to stay in an environment, the amount of inconsistency between apps and devices is a strong indicator that sound level apps should not be relied on.The utility of cell phone sound level meter apps is found when the user is looking for a general idea of the sound level of an environment, with no noise protection measures dependent on the results acquired. Our data suggest that users should proceed with caution when assessing noise levels using smartphone applications, especially because a number of situations underestimated the noise levels.
Limitations
As the measurements for this study were obtained in real-world situations with a variety of devices, there were many limitations that could impact the quality of each recording. Overcrowding in the bus and Skytrain limited the standardization of placement between the devices obtaining the measurements. Furthermore, changing trains was also required between measurements to obtain all of the necessary information. In some of the settings (e.g., public transit, restaurant, nightclub), movement of individuals in front of the microphones may have created sound-shadow effects, affecting the recordings. During all measurements, the devices were held out in front of the body. However, there were fluctuations in height and extension as muscles became fatigued in all locations. Additionally, it was difficult to control jostling in transit settings.
While all situations were recorded using both an iOS and Android device along with a SLM, the exact model of cell phone varied across situations. Each phone has its own variations and different hardware, affecting the results acquired. Along with hardware differences, the age of phones varied. Over time, the integrity of the microphones may have degraded or become less efficient with the use and accumulation of debris.
It is important to also consider that the microphone sensitivities will influence the measurements taken. That, in addition to the internal programming, positioning of the phone, and additional environmental factors will play a role in the samples taken.
Contribution of the Study to the Literature
There are many concerns regarding noise exposure levels in the workforce. It is important to also consider the environments with high levels of noise exposure that individuals are participating in recreationally. Having knowledge of these situations can help create awareness for this issue. Future research and usage of these apps could involve the creation/expansion of public noise maps to represent the average sound levels in certain locations. Environmental noise is often a complaint of people who are hard of hearing, in which they find many social environments too loud, thus hindering communication. Having descriptive information on the average noise levels of a variety of locations allows for people to find somewhere suitable to their specific social and communicative needs. This would lead to mitigating negative experiences due to noise levels in social environments.
The development of these mobile apps is a step toward increasing awareness and providing an open space for a dialogue regarding environmental noise and the long term risks of overexposure to noise. Our results ultimately recommend that users of the assessed apps use them as a reminder for preventative measures when it comes to the health of one's hearing. They do not provide accurate measurements of situational noise, and should not be used as the sole determinant to the length of permissible exposure limit.
Future Directions for the Study
Future assessment of sound levels will likely be tied to analysis through mobile or handheld devices. Further research could include more quantitative information across locations, mobile phone type, and applications over a longer period of time. Additionally, addressing sound variation across locations would look to answer additional questions to the accuracy of sound measurement through mobile devices.
Acknowledgements
It is necessary to recognize the limitations of our studies, including the limited number of devices used and a small representative sample of the six environments evaluated. This study was conducted in a minimal time frame. The majority of the recordings were taken in the span of six days, which may limit additional extrapolation. This study was not funded in any way by the application or phone manufacturers.
We would like to thank WorkSafe BC for supplying the SLMs for our project, and Kia Lidster for all of her technical expertise and support. We would also like to thank the School of Audiology and Speech Sciences, University of British Columbia for financially supporting this project. Finally, thank you to Dr. Navid Shahnaz and Sasha Brown, M.Sc. for all of their direction and insights.
References
1. Kardous CA and Shaw PB. Evaluation of smartphone sound measurement applications (apps) using external microphones—A follow-up study. J Acoust Soc Amer 2016;140(4), EL327-EL333. doi:10.1121/1.4964639
2. World Health Organization. Deafness and hearing loss. (March 2020). Available at: https://www.who.int/news-room/fact-sheets/detail/deafness-and-hearing-loss.
3. Murphy E and King EA. Testing the accuracy of smartphones and sound level meter applications for measuring environmental noise. Applied Acoustics 2016;106:16-22. doi:10.1016/j.apacoust.2015.12.012.
4. Chasin M. Smartphones and microphones. Hear Rev 2017;24(12):10.
5. Din E. ISO/IEC 17025. General requirements for the competence of testing and calibration laboratories. 2000.
6. Standards Council of Canada - CAN/CSA-Z107.56-06 (R2011). 2019.. Available at: https://www.scc.ca/en/standardsdb/standards/22979
7. WorkSafe BC. Sound Advice: A Guide to Hearing Conservation Programs. Vancouver, BC: Workers’ Compensation Board of British Columbia; 2017.
8. Bray A, Szymański M, and Mills R. Noise induced hearing loss in dance music disc jockeys and an examination of sound levels in nightclubs. J Laryngol Otol 2004;118(2):123–28.
9. Johnson O, Andrew B, Walker D, et al. British university students' attitudes towards noise-induced hearing loss caused by nightclub attendance. J Laryngol Otol2014;128(1):29–34.
10. Nast DR, Speer WS, and Le Prell CG. Sound level measurements using smartphone" apps": Useful or inaccurate? Noise Health 2014;16(72):251.
About the Authors

Elizabeth Dunlop, Haley Gynane, Mitchell Harris, Shandryn Kozin, Danielle Lafleur, Kelsey Miller, Stephanie Monette, Darren Roussel, Saruka Santhiran, Natalie Tran, Jaclyn Wiebe
Supervisor: Navid Shahnaz, PhD.; Sasha Brown, MSc
School of Audiology and Speech Sciences, University of British Columbia
CONTACT AUTHOR
Navid Shahnaz, PhD, Aud. (C)
Associate Professor
School of Audiology & Speech Sciences
Faculty of Medicine
University of British Columbia
2177 Wesbrook Mall, Friedman Building
Vancouver, BC Canada V6T 1Z3
E-mail: nshahnaz@audiOSpeech.ubc.ca
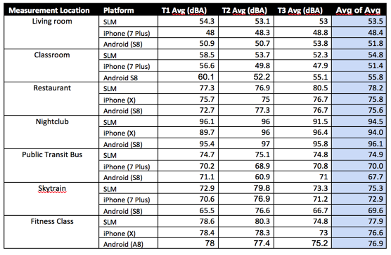
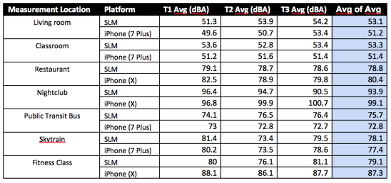
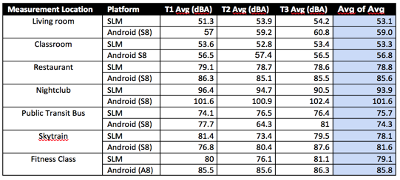
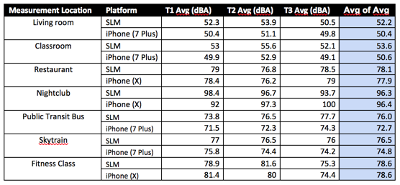
Appendix 1
Raw measurements for each app at time 1, time 2, and time 3 (T1, T2, T3) across different locations, along with the average measurement from the three different time points (Avg of Avg).