Mysteries of the Hearing Brain
Identification of Auditory Processing Disorders With the cABR

Last January, I participated in a workshop entitled “2nd Annual cABR workshop incorporating the cABR /FFR into the evaluation of (central) auditory processing disorder.” This workshop was organized by Drs. Charlotte Douglas and Debbie Davis who have been using the cABR to assess CAPD in their Audiology practices. cABR stands for auditory brainstem response to complex sounds. At this workshop, Dr. Steve Aiken provided a background on how speech-evoked responses relate to different levels of neural processing, and Dr. Laura Polich provided practical information and virtual demonstrations of how she has used the cABR to assist with the diagnosis of CAPD in her clinical practice. In addition, I provided a brief history of the cABR and described how it might be used in various clinical applications. I was excited to see the workshop attendees’ enthusiastic response to using objective electrophysiologic measures to evaluate central auditory processing.
The cABR is also known as the frequency-following response (FFR), as the stimulus frequency is mirrored in the response frequency. This response was first observed in infants by Gardi et al.1 Initially, investigators hoped that the FFR could be used to diagnose hearing loss in infants, but studies showed that the FFR was more sensitive to low frequencies than higher frequencies, so this testing could not replace the ABR in infant threshold testing. The commercial version of the cABR (the BioMAP) first became available in 2005 as a module on the Biologic evoked potential system. At that time, I was conducting CAPD evaluations in my clinical practice, and I was eager to incorporate an objective measure of neural auditory processing in my test battery. I found the test to be valuable, both in diagnosing CAPD and assessing treatment outcomes. This experience with objective measurement of auditory processing was one of the motivating factors in my decision to join Nina Kraus’s lab as a Ph.D. student in 2007.

cABR analysis is similar to the ABR in that identifying peak latencies is one of the key measurements. Wave V of the cABR is analogous to Wave V of the ABR, with an average latency in children aged 8-11 years of 5.60 ms. In Figure 1, Waves V and A have been identified in waveforms from two different patients (Panels A and B). Wave A is the trough following Wave V, commonly identified as VI on the ABR. The software calculated a BioMAP score based on the latency measurements, the slope between Waves V and A, and frequency energy in the first formant and higher frequencies. This software module is no longer available on the NATUS platform, but a different version of the software is now available through Intelligent Hearing Systems. The software includes several different stimuli and analyses which may be chosen based on the clinical concerns of an individual patient. For example, an audiologist evaluating auditory processing in a child with autism spectrum disorder may choose to evaluate brainstem processing of pitch changes.
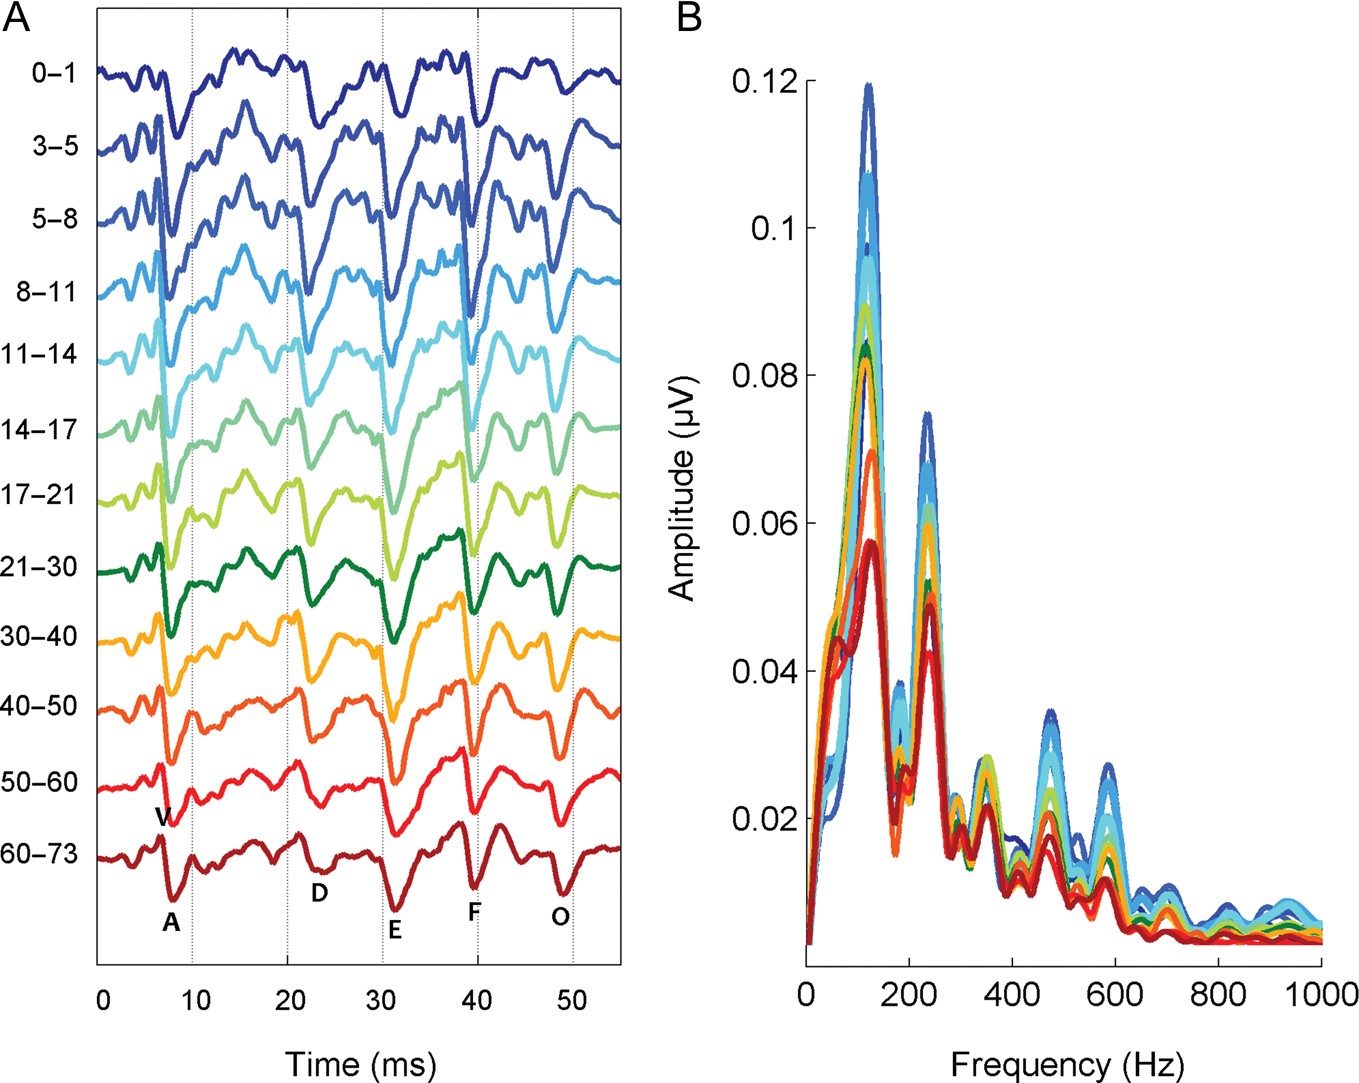
Nina Kraus’s lab recorded responses to a 40-ms /da/ syllable from hundreds of individuals from a wide range of ages and published normative values in Skoe et al.2 Figure 2 shows responses in the time and frequency domains from infancy to older age. Peak latencies are earliest during elementary school ages (5 to 11 yrs). Latencies are stable from the teenage years through middle age and then gradually increase again with age. These latency values and other measures can be used to determine whether a particular child’s responses fall outside the normal range.
To a certain degree, all behavioral measures in the central auditory processing battery are affected by language or cognitive ability. A key advantage of the cABR is that it does not require active participation by the listener, and it can therefore be used with very young children. Given the growing interest in assessing auditory function beyond the cochlea, it is hoped that audiologists will embrace new technologies to improve the diagnosis and management of central auditory disorders.
References
- Gardi J, Salamy A, and Mendelson T. Scalp-recorded frequency-following responses in neonates. Int J Audiol 1979;18:494–506.
- Skoe E, Krizman J, Anderson S, and Kraus N. Stability and plasticity of auditory brainstem function across the lifespan. Cereb Cortex 2015;25:1415–26.