Changes in the prevalence and characteristics of hearing loss in a noise-exposed population between 1980 and 2015

Sasha Brown*1,2, Lorienne M. Jenstad†¹,3, Angela Ryall¹ and Ellen Stephenson4
1School of Audiology & Speech Sciences, The University of British Columbia
2WorkSafeBC
3Wavefront Centre for Communication Accessibility
4Department of Community and Family Medicine, The University of Toronto
Note: Reprinted with permission from Canadian Acoustics, Vol. 49, No. 1, (2021), pp. 23-34. The official journal of the Canadian Acoustical Association.
Résumé
La mise à jour des réglementations, l'amélioration de la réduction du bruit et l'utilisation accrue des dispositifs de protection auditive (PA) peuvent permettre aux travailleurs exposés au bruit de mieux entendre. Dans une étude de cohorte rétrospective (1980-2015), nous avons effectué une analyse secondaire d'une base de données de tests auditifs annuels effectués sur des travailleurs exposés au bruit âgés de 20 à 55 ans. La taille de l'échantillon par cohorte variait de n=1386 à n=5165. Aucune différence de cohorte cliniquement significative dans les seuils de 5 dB ou plus n'a été trouvée pour les 20 ou 30 ans. Pour les 45 et 55 ans, les cohortes nées plus tard avaient de meilleurs seuils que les cohortes nées plus tôt. La prévalence de la perte auditive a diminué pour les cohortes nées plus tard pour les 30, 45 et 55 ans. Les jeunes de 20 ans dans les cohortes ultérieures étaient plus susceptibles d'utiliser des PA que ceux des cohortes antérieures. La prévalence plus faible de la perte auditive et les seuils plus élevés chez ces travailleurs exposés au bruit peuvent être dus à l'utilisation accrue des appareils de protection auditive, aux changements de la réglementation sur le lieu de travail, à l'amélioration du contrôle du bruit sur le lieu de travail ou à l'évolution des attitudes à l'égard de l'exposition au bruit dans les loisirs.
Mots clefs : Perte auditive due au bruit ; longitudinal ; protection auditive ; travailleurs ; prévalence, Colombie britannique
Abstract
Updated regulations, improved noise reduction, and increased use of hearing protective devices (HPDs) may result in better hearing for noise-exposed workers. In a retrospective (1980-2015) cohort study, we conducted a secondary analysis of a database of annual hearing tests from noise-exposed workers aged 20-55 years old. Sample size per cohort ranged from n=1386 to n=5165. No clinically-meaningful cohort differences in thresholds of 5 dB or greater were found for 20- or 30-year olds. For 45- and 55-year olds, later-born cohorts had better thresholds than earlier-born cohorts. Prevalence of hearing loss decreased for later-born cohorts for 30, 45, and 55-year olds. Twenty-year olds in later cohorts were more likely to use HPD than those in earlier cohorts. The lower prevalence of hearing loss and better thresholds in these noise-exposed workers may be due to increased HPD use, changes in workplace regulations, improved workplace noise control, or changed attitudes towards recreational noise exposure.
1. Introduction
Hearing loss is the most common sensory deficit in older adults and is recognized to be a global social and health problem [1]. Untreated hearing loss of a moderate or greater degree affects communication and can contribute to social isolation, depression, and poorer job performance [2,3]. Additionally, the damage associated with significant noise exposure leads to disabling hearing problems beyond audiometric changes, such as difficulties hearing in noise, tinnitus, and hyperacusis [4,5]. Both age-related hearing loss (ARHL), and noise-induced hearing loss (NIHL), contribute significantly to the prevalence of hearing loss, particularly among older adults, with NIHL considered to be the most common occupational disease [6]. Forty percent of working-age Canadians reported noise exposure that would be considered hazardous at some time during their working lives [7], with worldwide studies indicating that the prevalence of work-related hearing loss ranges from 16-24% [8].
For decades, the World Health Organization has raised concerns that NIHL is on the rise due to recreational and industrial noise [9,10,11]; however, some researchers have noted that prevalence of hearing loss is decreasing in the general population, particularly in men [12]. Changes in noise control and hearing conservation strategies in noisy industries may contribute to this noted reduction in hearing loss. Though results are mixed [13], there is evidence that changes in legislation and focus on hearing loss prevention through engineered noise controls [14], and properly fitted hearing protection [15], ultimately reduce the level of noise exposure. These strategies, along with education and awareness to employers and workers, and regular hearing surveillance with one to one counselling, might reduce the effects of occupational noise on hearing thresholds [16].
In British Columbia, an occupational regulation requiring hearing protection in hazardous noise has been in place since 1967, with more extensive Noise Control and Hearing Conservation programs implemented in 1978 [17]. Since that time, particularly with changes to the relevant WCB Occupational Health and Safety Regulations in 1996 [18], there has been an increased focus on education and awareness of workers and employers along with inspection and enforcement to increase compliance. It is important to understand whether these efforts have the intended result of reducing the incidence of occupational NIHL. Though there have been longitudinal studies looking at changes in hearing, most have results spanning 10 years or fewer [eg.2,4,19]. Davies et al [20] specifically studied lumber mill workers’ hearing test results from 1970-1996, and found that over time, the risk of shift in hearing thresholds decreased, suggesting that Hearing Conservation Programs are effective. Other than this study, we are not aware of research investigating a noise-exposed Canadian population, and none that examine the impact of new regulations introduced in British Columbia in 1996.
Audiometry is typically conducted to monitor and flag early signs of NIHL. Since 1978, employers in British Columbia must provide annual hearing tests to workers who are exposed to occupational noise that exceeds criterion levels. This allows authorities to monitor for early flags for NIHL; that is, significant changes in thresholds at the frequencies first affected by noise: 3000, 4000, and 6000 Hz. In 1979 almost 78,000 tests were submitted to WorkSafeBC annually and in 2018 this had risen to 178,000 tests. The hearing test results spanning over 40 years are maintained in a database (“Industrial Audiometric System”). By examining the data available from these hearing tests, we can address questions regarding changes in NIHL over time in individuals and across cohorts to determine whether NIHL is indeed on rise, or whether greater awareness of noise in the workplace has been successful at reducing NIHL in Canada.
The purpose of this retrospective cohort study is to analyze existing cross-sectional and longitudinal data in a large database spanning forty years, to determine whether there are cohort effects in prevalence and progression of noise-induced hearing loss. This study builds on the research of Davies et al [20] by expanding to include all noisy industries and data from 1980 to 2015. This data set will allow us to see effects of revised and additional regulations introduced in 1996 and provide current data on the prevalence of hearing loss and characteristics of hearing thresholds in an age-stratified noise-exposed population in Canada. For the purpose of this study, 5 cohorts were selected with birth years in 1935, 1960, 1970, 1985 and 1995. We compared the prevalence, degree, and configuration of hearing loss in 4 age groups (20, 30, 45, and 55-year olds) in different test years to determine whether there are age and cohort effects on hearing.
2. Method
2.1 Participants
Participants were individuals born in 1935, 1960, 1970, 1985, and 1995 who received a hearing test in British Columbia as part of an occupational hearing conservation program in at least one of the four test years of interest: 1980, 1990, 2005, 2015. The sample size for each cohort and test year varied as a function of the total number of tests available and is reported in Table 1. The de-identified hearing test results were obtained from WorkSafeBC’s Data Warehouse which is populated by nightly extracts of data from the Industrial
Audiometric source database. The data were derived using Tableau Developer Visualization software and presented to the researchers as an Excel spreadsheet.
A Privacy Impact Assessment was reviewed and approved by WorkSafeBC’s Freedom of Information and Protection of Privacy office to ensure that no individual could be identified from the results. No names, other identification, or demographic information were included in the data provided to the researchers. Informed consent was not needed for this analysis. Ethical approval was received from UBC Behavioural Research Ethics Board.
Hearing test results were obtained from the WorkSafeBC database according to Table 1. For each cohort, results were gathered for each birth year, and then filtered for any tests in the chosen year. For example, Cohort 3’s results were formed from test results for those born in 1970 and hearing test results in 1990 and 2015. All available hearing tests that met the criteria were included in the dataset. Because data were obtained based on birth year, not age at time of test, there is a one-year range of possible ages for each cohort/ test year. For example, individuals born in 1960 and tested in 1980 could be either 19 years of age (if tested prior to their birthday) or 20 years of age (if tested after their birthday). For ease of reporting, age at time of testing is reported as test year minus birth year, regardless of actual age. The sample size (i.e., number of tests available) for each cohort and test year is given in the table.
| Year of hearing test | ||||
| Year of birth | 1980 | 1990 | 2005 | 2015 |
| Cohort 1 (born 1935) | Age 45 n=1386 | Age 55 n=2124 | ||
| Cohort 2 (born 1960) | Age 20 n=2165 | Age 30 n=5165 | Age 45 n=4558 | Age 55 n=4158 |
| Cohort 3 (born 1970) | Age 20 n=2326 | Age 45 n=3764 | ||
| Cohort 4 (born 1985) | Age 20 n=2495 | Age 30 n=3949 | ||
| Cohort 5 (born 1995) | Age 20 n=2322 |
Table 1: Sample size as a function of cohort and test year.
2.2 Procedures
All hearing tests were conducted by technicians trained to follow a testing protocol and collected in facilities meeting minimum standards set out by WorkSafeBC in accordance with CSA Z107.6 [21]. Air-conducted pure-tone thresholds were recorded for 500, 1000, 2000, 3000, 4000, 6000, and 8000 Hz in each ear. At the time of the test, answers to questions about workers’ noise history and the type of hearing protection device worn, if any, were recorded. The results were submitted to WorkSafeBC and stored in a database (“Industrial Audiometric database”). The data in this study were extracted from this database.
2.3 Data analysis
Data analysis was run in R version 3.5.1 [22]. Means and standard deviation were calculated for pure-tone thresholds for each frequency and compared for people at the same age from different birth cohorts. Comparisons were made based on clinically meaningful effect sizes (i.e., more than 5 dB change in mean thresholds across cohorts), rather than null hypothesis significance testing. With thousands of cases per cohort, all clinically
meaningful differences would also be statistically significant based on conventional null hypothesis significance testing. For changes in pure-tone thresholds, only data from the left ear were used in the analysis.
To determine prevalence of hearing loss in the sample, we used a speech frequency pure-tone average (PTA) based on thresholds at 0.5, 1, 2, and 4 kHz consistent with Canadian Health Measures Survey [23]. Hearing loss was considered present if the PTA of either ear was poorer than 25 dB HL. Chi-squared tests were used to compare prevalence of hearing loss among people of the same age from different birth cohorts. If there was evidence of significant differences, additional pairwise comparisons were made between successive birth cohorts.
Chi-squared tests were also used to examine differences in the use of hearing protection among 20-year olds from different birth cohorts. If the test indicated significant differences across the four birth cohorts, a series of pairwise comparisons between successive cohorts was conducted.
3 Results
3.1 Data quality checks
The data were checked for errors or invalid results; using the rule that any thresholds better than 0 dB HL or poorer than 120 dB HL should be considered invalid given the limits of the audiometers used in testing, 11 hearing tests were dropped from the analysis. Some individuals had more than one hearing test per year, which can happen if, for example, the worker was at multiple job sites, or changed location of employment over the year. When this occurred, only the first hearing test per year was used in the analysis.
3.2 Hearing thresholds by age and cohort
Is the hearing of 20-year-olds different in 1980, 1990, 2005, and 2015?
In comparing the hearing of 20-year olds from different cohorts, we focused on the high frequencies 2000, 3000, 4000, and 6000 Hz in particular. As mentioned, given the large sample size, even small differences could be statistically significant, so we instead chose a clinically-meaningful effect of a difference of at least 5 dB between cohorts. At these frequencies of interest, group differences were all less than 5 dB, indicating no difference in hearing of 20-year-olds from different cohorts. Thresholds for this cohort at all audiometric frequencies, along with the 95% confidence intervals, are given in Table 2 and Figure 1.
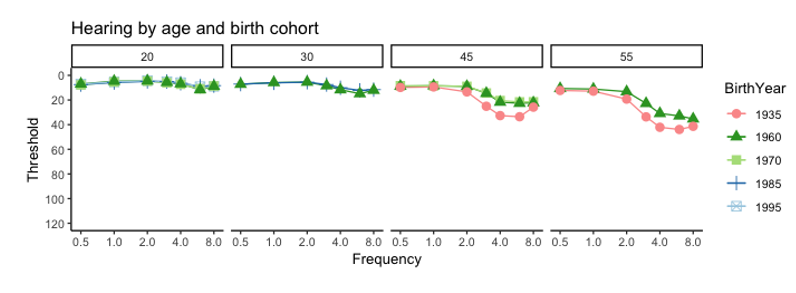
Table 2: Observed threshold means by cohort and frequency for 20-year olds
| Freq. | Cohort | N | Mean | sd | 95% CI [LL,UL] |
| 500 Hz | 1960 1970 1985 1995 | 2165 2326 2495 2322 | 7.0 7.8 7.5 7.1 | 7.1 7.4 6.3 6.5 | [6.7, 7.3] [7.5, 8.1] [7.3, 7.7] [6.8, 7.3 |
| 1000 Hz | 1960 1970 1985 1995 | 2165 2326 2495 2322 | 4.7 5.4 5.8 5.3 | 7.2 7.6 6.3 6.0 | [4.3, 5.0] [5.1, 5.7] [5.6, 6.0] [5.1, 5.5] |
| 2000 Hz | 1960 1970 1985 1995 | 2165 2326 2495 2322 | 4.5 4.7 4.9 4.4 | 7.5 8.3 6.3 6.3 | [4.2, 4.8] [4.3, 5.0] [4.6, 5.2] [4.1, 4.7] |
| 3000 Hz | 1960 1970 1985 1995 | 2165 2326 2495 2322 | 5.7 6.0 5.0 5.2 | 8.9 9.5 7.2 7.1 | [5.3, 6.1] [5.6, 6.4] [4.7, 5.3] [4.9, 5.5] |
| 4000 Hz | 1960 1970 1985 1995 | 2165 2326 2495 2322 | 6.8 7.3 6.4 5.9 | 10.0 10.4 8.2 7.7 | [6.4, 7.2] [6.9, 7.7] [6.0, 6.7 [5.6, 6.2] |
| 6000 Hz | 1960 1970 1985 1995 | 2165 2326 2495 2322 | 11.6 10.9 8.8 9.2 | 12.2 11.5 9.6 9.8 | [11.1, 12.1] [10.4, 11.4] [8.4, 9.2] [8.8, 9.6] |
| 8000 Hz | 1960 1970 1985 1995 | 2165 2326 2495 2322 | 8.8 8.6 8.3 9.0 | 12.2 10.7 9.7 9.7 | [8.3, 9.3] [8.2,9.0] [7.9,8.7] [8.6,9.4] |
Is the hearing of 30-year-olds different in 1990 and 2015?
In comparing the hearing of 30-year olds from different cohorts, we again focused on the high frequencies 2000, 3000, 4000, and 6000 Hz. Again, we chose a clinically-meaningful effect of a difference of at least 5 dB between cohorts. At these frequencies of interest, group differences were all less than 5 dB, indicating no difference in hearing of 30-year-olds between the two cohorts. Thresholds for this cohort at all audiometric frequencies, along with the 95% confidence intervals, are given in Table 3 and Figure 1.
Table 3: Observed threshold means by cohort and frequency for 30-year olds.
| Freq. | Cohort | N | Mean | sd | 95% CI [LL,UL] |
| 500 Hz | 1960 1985 | 5165 3949 | 7.2 7.1 | 7.5 7.2 | [7.0, 7.4] [6.9, 7.3] |
| 1000 Hz | 1960 1985 | 5165 3949 | 5.9 6.1 | 7.7 7.3 | [5.7, 6.1] [5.9, 6.3] |
| 2000 Hz | 1960 1985 | 5165 3949 | 5.5 5.5 | 8.5 7.8 | [5.3, 5.7] [5.3, 5.7] |
| 3000 Hz | 1960 1985 | 5165 3949 | 8.4 7.5 | 11.1 9.6 | [8.1, 8.7] [7.2, 7.8] |
| 4000 Hz | 1960 1985 | 5165 3949 | 11.7 10.1 | 13.5 11.0 | [11.3, 12.1] [9.8, 10.4] |
| 6000 Hz | 1960 1985 | 5165 3949 | 14.9 12.2 | 13.9 12.0 | [14.5, 15.3] [11.8, 12.6] |
| 8000 Hz | 1960 1985 | 5165 3949 | 12.1 11.6 | 13.2 12.1 | [11.7, 12.5] [11.2, 12.0] |
Is the hearing of 45-year-olds different in 1980, 2005, and 2015?
In comparing the hearing of 45-year olds from different cohorts, we again focused on the high frequencies 2000, 3000, 4000, and 6000 Hz. As with the previous cohorts, given the large sample size, even small differences could be statistically significant so instead we chose a clinically-meaningful effect of a difference of at least 5 dB between cohorts. The group differences at 2000 Hz were smaller than 5 dB, indicating no meaningful difference in thresholds across cohorts. At 3000, 4000, and 6000 Hz, the 1935 cohort had thresholds that were 10 dB or more poorer than the 1960 and 1970 cohort, which demonstrates a clinically-meaningful improvement in thresholds for later cohorts. Thresholds for this cohort at all audiometric frequencies, along with the 95% confidence intervals, are given in Table 4 and Figure 1.
Table 4: Observed threshold means by cohort and frequency for 45-year olds
| Freq. | Cohort | N | Mean | sd | 95% CI [LL,UL] |
| 500 Hz | 1935 1960 1970 | 1386 4558 3764 | 9.8 8.8 8.4 | 10.6 8.5 8.3 | [9.2, 10.4] [8.6, 9.0] [8.1, 8.7] |
| 1000 Hz | 1935 1960 1970 | 1386 4558 3764 | 9.4 8.4 8.5 | 11.5 9.0 8.8 | [8.8, 10.0] [8.1, 8.7] [8.2, 8.8] |
| 2000 Hz | 1935 1960 1970 | 1386 4558 3764 | 13.4 9.0 8.9 | 15.5 10.3 10.2 | [12.6, 14.2] [8.7, 9.3] [8.6, 9.2] |
| 3000 Hz | 1935 1960 1970 | 1386 4558 3764 | 25.1 14.6 14.3 | 20.6 14.8 13.9 | [24.0, 26.2] [14.2, 15.0] [13.9, 14.7] |
| 4000 Hz | 1935 1960 1970 | 1386 4558 3764 | 32.7 21.7 20.4 | 20.9 17.1 16.2 | [31.6, 33.8] [21.2, 22.2] [19.8, 20.9] |
| 6000 Hz | 1935 1960 1970 | 1386 4558 3764 | 33.6 22.7 21.5 | 21.3 17.0 16.2 | [32.5, 34.7] [22.2, 23.2] [21.0, 22.0] |
| 8000 Hz | 1935 1960 1970 | 1386 4558 3764 | 25.8 22.3 21.5 | 22.4 17.9 17.3 | [24.6, 27.0] [21.8, 22.8] [20.9, 22.1] |
Is the hearing of 55-year-olds different in 1990 and 2015?
In comparing the hearing of 55-year olds from different cohorts, we again focused on the high frequencies 2000, 3000, 4000, and 6000 Hz. and chose a clinically-meaningful effect of a difference of at least 5 dB between cohorts. The group differences at all frequencies of interest were at least 5 dB, and greater than 10 dB at 3000, 4000, and 6000 Hz. The 1935 cohort had thresholds that were poorer than the 1960 cohort, which demonstrates a clinically-meaningful improvement in thresholds for the later cohort. Thresholds for this cohort at all audiometric frequencies, along with the 95% confidence intervals, are given in Table 5 and Figure 1.
Table 5: Observed threshold means by cohort and frequency for 55-year olds.
| Freq. | Cohort | N | Mean | sd | 95% CI [LL,UL] |
| 500 Hz | 1935 1960 | 2124 4158 | 12.3 10.7 | 11.3 9.8 | [11.8, 12.8] [10.4, 11.0] |
| 1000 Hz | 1935 1960 | 2124 4158 | 12.8 11.1 | 12.6 11.0 | [12.3, 13.3] [10.8, 11.4] |
| 2000 Hz | 1935 1960 | 2124 4158 | 19.3 13.2 | 18.0 12.8 | [18.5, 20.0] [12.8, 13.6] |
| 3000 Hz | 1935 1960 | 2124 4158 | 33.7 22.8 | 21.5 18.0 | [32.3, 34.6] [22.3, 23.3] |
| 4000 Hz | 1935 1960 | 2124 4158 | 42.1 30.9 | 21.2 19.1 | [41.2, 43.0] [30.3, 31.5] |
| 6000 Hz | 1935 1960 | 2124 4158 | 43.9 32.9 | 21.8 19.4 | [43.0, 44.8] [32.3, 33.5] |
| 8000 Hz | 1935 1960 | 2124 4158 | 41.4 35.3 | 23.0 21.5 | [40.4, 42.4] [34.6, 36.0] |
3.3 Prevalence of hearing loss in each cohort by age
We compared the prevalence of hearing loss for each age, that is 20-year-olds, 30-year-olds, 45-year-olds and 55-year-olds, across birth cohorts to determine if there was a significant difference based on the year of birth. The results are displayed in Figure 2 with the chi-square analysis given in Appendix A.
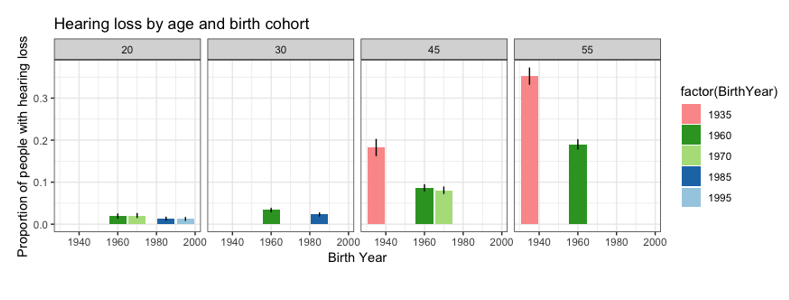
20-year olds
We had four cohorts of 20-year-olds, those who were born in 1960, 1970, 1995 and 2005, and found that there were no significant differences in the prevalence of hearing loss in 20-year olds born in those years. (Χ2 = 7.59, df = 3, p = .055).
30-year olds
When we compared 30-year-olds from two birth cohorts, born in 1960 and born in 1985, there were significant differences observed in the prevalence of hearing loss among 30-year olds from different birth cohorts (Χ2 = 8.51, df = 1, p = .004). People born in 1960 were more likely to have hearing loss by age 30 (3.37%) compared to people born in 1985 (2.33%).
45-year olds
There were significant differences observed in the prevalence of hearing loss among 45-year olds from different birth cohorts (Χ2 = 131.08, df = 2, p <.001). People born in 1935 were more likely to have hearing loss by age 45 (18.24%) compared to people born in either 1960 (8.66%, Χ2 = 100.53, df = 1, p < .001) or 1970 (8.06%, Χ2 = 108.441, df = 1, p <.001). There were no significant differences in the prevalence of hearing loss observed among 45-year olds born in 1960 compared to those born in 1970 (Χ2 = 0.902, df = 1, p = .342).
55-year olds
There were significant differences observed in the prevalence of hearing loss among 55-year olds from different birth cohorts (Χ2 = 200.9, df = 1, p < .001). People born in 1935 were more likely to have hearing loss by age 55 (35.22%) compared to people born in 1960 (18.99%).
3.4 What proportion of 20-year-olds wear hearing protection?
Table 6 shows that there were significant differences observed in the use of hearing protection among 20-year olds from different birth cohorts (Χ2 = 549.9, df = 3, p < .001). Use of hearing protection was least prevalent among 20-years old born in 1970 (58.68%), with significantly higher rates observed in the preceding cohort born in 1960 (65.22%, Χ2 = 20.291, df = 1, p < .001) and the subsequent cohorts born in 1985 (80.45%, Χ2 = 271.32, df = 1, p <.001) and 1995 (Χ2 = 405.71, df =1, p <.001).
There were also significant differences when comparing those born in 1960 to later cohorts born in 1985 (Χ2 = 137.63, df = 1, p <.001) and 1995 (Χ2 = 242.97, df = 1, p <.001). Use of hearing protection was most common in the most recent cohort of 20-year olds, such that a greater proportion of 20-year olds born in 1995 reported using hearing protection compared to those born in 1985 (Χ2 = 19.25, df = 1, p < .001) or any of the earlier cohorts.
Table 6: Results of the chi-square analysis comparing proportion of reported hearing protection use in 20-year-olds across cohorts. Post-hoc pairwise comparisons are given when appropriate to do so.
| Birth Year | N | Proportion reporting “Yes” to using HPD | Pairwise comparisons | |
| 1960 | 2165 | 65.22% | 1960 vs 1970: Χ = 20.291, df = 1, p<.001 1960 vs 1985: Χ = 137.63, df = 1, p<.001 1960 vs 1995: Χ = 242.97, df = 1, p<.001 | |
| 1970 | 2326 | 58.68% | 1970 vs 1985: Χ = 271.32, df = 1, p<.001 1970 vs 1995: Χ = 405.71, df = 1, p<.001 | |
| 1985 | 2496 | 80.45% | 1985 vs 1995: Χ = 19.25, df = 1, p<.001 | |
| 1995 | 2322 | 85.23% |
Discussion
In this retrospective cohort study examining changes in hearing and thresholds from 1980-2015 in noise-exposed workers, we found that hearing thresholds generally improved with later cohorts, prevalence of hearing loss decreased, and HPD use increased. Specifically, for 45- and 55-year olds, later-born cohorts had better thresholds than earlier-born cohorts, with no change in thresholds across cohorts for 20- or 30-year olds. Prevalence of hearing loss decreased for later-born cohorts for 30, 45, and 55-year olds. Twenty-year olds in later cohorts were more likely to use HPD than those in earlier cohorts.
It is of interest to understand these changes in hearing. While our secondary analysis of an existing database is unable to determine the reason for the change, we consider several potential factors, including changes in how hearing was tested over time, changes in provincial regulations regarding safe noise exposure, changes in recreational noise exposure, improved use of engineering controls (and other) in noisy workplaces, and finally, increased use of HPDs.
First, we consider whether improved hearing can be attributed to systematic error; that is, changes in how hearing was tested over time. It seems unlikely that systematic testing changes can explain our results. The low frequencies serve as controls; as Tables 2-5 show, we found no changes in thresholds at 500 and 1000 Hz across cohorts when using the criterion of a 5 dB change as meaningful. This helps rule out random or systematic error in testing circumstances. Additionally, we can look at results for different cohorts tested in the same year, where protocols would have been standard across the province. For example, we had data from three ages tested in 1990 (20, 30, and 55-year olds). When we compare each of those ages to the same age tested in a different year, only one cohort (age 55) showed significant differences from cohorts tested at another time, meaning that it is unlikely the different thresholds were due to different test protocols. If it were a change in test protocol, the 20- and 30-year olds would also have had significant differences relative to their age-matched peers tested in different years.
Second, we consider whether seemingly improved hearing can be attributed to changes in regulations that change the definition of a noisy workplace. A potential confound in our study was that with the change in regulations in 1996, the criteria for implementing a hearing conservation program was changed from 90 dBA Lex to 85 dBA Lex. Though between 1980 and 1996, workplaces that exceeded 90 dBA Lex were required to provide hearing tests to individual workers exposed to levels above 85 dBA Lex, the 1996 revision likely resulted in more workplaces overall meeting the criteria for hearing conservation and hearing tests. Thus, it is likely that more individuals included in later cohorts had lower doses of noise exposure (between 85 dBA Lex and 90 dBA Lex). This change may have contributed to better thresholds and lower prevalence of hearing loss than in previous cohorts. To examine this potential confound, we conducted a subset analysis for specific occupations in two different test years, minimizing the likelihood that the change in regulations would be a factor in any cohort differences noted. We identified three occupations for this analysis: Equipment operator/Heavy; Front end loader/ forklift operator; and Heavy-duty mechanic. These occupations were chosen as they were categories used in both test years with at least 20 in each cohort. We focused on 45-year olds in two cohorts: born in 1935 and born in 1970. Forty-five is when we started to see cohort differences. The relevant test years were 1980 and 2015, well before and after the change in regulations. For this analysis, again instead of conducting inferential statistics, we used the clinically-meaningful change of 5 dB difference in thresholds between groups. Appendix B shows the results for 3000, 4000, and 6000 Hz for both cohorts for each of the three occupations. For all three frequencies of interest across occupations there is at least 5 dB improvement in thresholds in the later cohorts, with most group differences being closer to 10-15 dB improvement. This lends support to the conclusion that hearing is improving with later cohorts of noise-exposed workers, not an artefact of a changed sample.
Third, we consider changes in recreational noise exposure; that is, noise outside of work environments. We do not have data on recreational noise exposure for this sample but there has been growing concern, often supported by popular media, that younger people are at increased risk for NIHL through poor listening habits and exposure to recreational noise (24). Recreational settings such as nightclubs, as well as personal stereos, are capable of producing sound well above hazardous levels [e.g., 25,26,27,28], and youth do not tend to prioritize safe listening and instead engage in “risky” listening behaviour while seldom wearing hearing protection [e.g., 24]. Together, this would suggest that NIHL is a growing concern among younger generations. Peer-reviewed literature, such as the review by Carter, et al [29], however, is cautious about drawing a link between recreational exposure and the presence of NIHL. Henderson et al. [24] for example, found that there was no significant increase in rates of NIHL (defined as thresholds 3-6 kHz 15 dB worse than .5-2 kHz, and 8 kHz) in 12-19-year olds from 1994 to 2005. Similarly, Le Prell et al. [30] found “no reliable relationships” between recreational noise exposure and hearing thresholds or other measures of NIHL (DPOAEs, etc) and Kepler et al [31] found no significant differences in 18-30 year olds’ hearing between groups with low, intermediate, and high recreational noise exposure.
The improved thresholds found in our later cohorts are inconsistent with the concern that recreational noise exposure is on the rise among youth and confirm the other studies described showing no increase in NIHL among young people. It is important to remember for our sample that we examined data for people working in noisy environments, which may not be generalizable to the whole population. This group may have more awareness of NIHL due to education and counselling that should come with the annual hearing test, as required by WorkSafeBC. Employers are required to provide education about noise and NIHL annually to workers who are exposed to hazardous noise and one-on-one counselling and training regarding hearing and hearing protection fit and use.
Fourth, it is possible that workplaces have implemented additional noise control and hearing conservation methods that have been effective in reducing NIHL. In 1996, British Columbia’s Occupational Health and Safety Regulation expanded on the 1980 Regulations which only required noise control, hearing protection devices, and annual hearing tests. The new regulations include noise measurements, engineered noise control, education and training about noise and NIHL, and an annual program review [18]. Other research has indicated that revisions to Hearing Conservation Program requirements can help reduce the incidence of NIHL [e.g., 32]. Since 1996, there has been a growing emphasis on the “hierarchy of control” in which employers must first explore and implement strategies to reduce the noise exposure levels if feasible. Methods including “buying quiet”, the enclosure of loud machinery or workspaces, reducing noise at the source with regular maintenance, and adding noise abatement materials have all proven effective at reducing noise levels in the workplace. A study of lumber mills in British Columbia [33] and WorkSafeBC noise measurements [34] have confirmed that in many workplaces these changes have reduced noise levels. It is likely that lower noise levels have contributed to lower incidence and severity of NIHL, as has been found in other jurisdictions [e.g., 14]
In this study, we gathered data on one component of the hearing conservation program: the use of hearing protection, which has been shown to be effective in reducing NIHL among workers [15, 35]. Twenty year olds’ self-reported use of HPDs increased from 65 to 85% from 1980 to 2015, similar to other studies including Fredriksen and colleagues [19], who found that between 2000 and 2010, HPD use increased from 70.1 to 76.1% in Danish workers. Feder and colleagues [7] showed that younger workers aged 16-29 reported wearing HPD more (86%) than older workers aged 50-79 (77%). We only examined self-report of HPD use at 20 years and we do not know how that predicts later HPD use, but the Feder data would support the assumption that differences in the proportion of HPD use at 20 also appear in later age groups.
Although thresholds improved for the later cohorts for 45- and 55-year olds, hearing loss was still present. This leads us to question why there was hearing loss and whether more noise control and hearing protection are needed. Age-related hearing loss (ARHL) is a general term for hearing loss that increases with age without ascribing any one cause to it but is often referred to as distinct from noise-induced HL (NIHL). Both NIHL and ARHL initially present with high-frequency sensorineural hearing loss and they both tend to be bilateral and symmetrical, making them hard to distinguish [36]. However, NIHL tends to result in a notch in the audiogram affecting thresholds from 3-6 kHz, while ARHL tends to start at higher frequencies, manifesting on the audiogram first at 8 kHz [36].This difference is not a reliable diagnostic marker and the difference between the types of HL is challenging to separate because they often co-occur in the same individual [37]. In our own data, we see a difference in audiogram shape between cohorts for the 45 and 55 year old groups, where later cohorts have audiograms that are more consistent with ARHL than NIHL, with thresholds at 8 kHz that are similar to or poorer than thresholds at lower frequencies. Earlier cohorts demonstrate the characteristic notch, whereby thresholds are poorer from 3-6 kHz than at 8 kHz.
To examine the hypothesis that later cohorts had audiograms consistent with ARHL rather than NIHL, we compared our later cohorts to ISO age-matched [38] for a population without significant occupational noise exposure. If the thresholds in our later cohorts are similar to the ISO thresholds for individuals without noise exposure, then it seems likely that ARHL is the main determinant of thresholds in our later cohorts. The ISO report includes several different data sets for comparison, including data from Sweden, the US, and Norway. For our comparison, we used unscreened data from Sweden as the most similar to our sample. “Unscreened” means that the sample could have otologic dysfunction but not occupational noise exposure, whereas the data from the US included those with occupational noise exposure. The data from Sweden represented both ears, whereas data from Norway were only the most sensitive ear. Our sample examined only left ear thresholds, which could have been the better or worse ear. ISO data are separated for males and females; we calculated a weighted average of male and female thresholds, with a weighting of .9014 for male thresholds and .0986 for female thresholds, reflecting the relative male/ female distribution in our dataset. We used the 50% percentile from the ISO data with a linear interpolation between the data for 50- and 60-year olds to calculate thresholds for 55-year olds to compare to our sample. Appendix C shows the data for the 55-year olds in our sample beside the thresholds calculated from the ISO dataset. For the low frequencies, up to 2000 Hz, we see that both cohorts have thresholds similar to the ISO Swedish unscreened thresholds. For the frequencies monitored for NIHL, 3, 4, and 6 kHz, the 1935 cohort had thresholds poorer than ISO by more than 10 dB, indicating an additional contribution of noise to the hearing loss seen in this sample as a whole. The 1960 cohort was within 5 dB of the ISO thresholds for 3 and 4 kHz, but poorer than ISO by 6 dB at 6 kHz. It seems that the role of noise in determining these thresholds is likely reduced for the 1960 cohort, but may still be present, given the small decline in thresholds at 6 kHz above what is expected due to ARHL alone.
4 Limitations and future directions
The data we obtained for analysis were de-identified with only limited demographic and potential moderating variables available. No gender data were available to link to individual audiograms, but we know that for each cohort, the percentage of males ranged from 89-95%. Further gender-based modelling of the data would be helpful to further understand the trends.
We made some assumptions about the cumulative noise exposure of individuals in the database given the limited data available. We assume that if the workers received an annual hearing test, they were exposed to noise levels in excess of 85 dBA Lex during the year of the test and between test years. However, it is possible that some employers err on the side of caution and test all workers regardless of job duties and noise exposure, or it is possible that some workers were only temporarily in noisy workplaces. Although some of these details are not available from the historical database, further analyses could purposefully sample smaller, more homogeneous groups by specific occupation, analyzing annual data for both thresholds and HPD use over time.
We examined a subset of the noise-exposed population who have had hearing tests, demonstrating they received at least one element of a hearing conservation program. While this demonstrates that hearing conservation programs seem to work for this population, the findings are not generalizable to workers who are exposed to noise but do not have annual hearing tests, which might also mean that other elements of a hearing conservation program are not implemented at their worksite.
5. Conclusion
This study demonstrated that the prevalence of hearing loss decreased, and hearing thresholds generally improved in an occupationally noise exposed population between 1980 and 2015 in British Columbia. The changes correlate with revisions to Workers’ Compensation Board regulations in which the criterion level for implementation of noise control and hearing conservation programs was lowered from 90 dBA Lex to 85 dBA Lex, and additional requirements were added. Increased education and awareness, improvement in engineered noise controls, and increased use of hearing protection devices might contribute to the better hearing seen in later cohorts.
Acknowledgments
Funding was provided by a Canadian Academy of Audiology (CAA) Clinical-Research Grant awarded to Sasha Brown and Lorienne Jenstad and by the Wavefront Centre for Communication Accessibility Research Division.
References
- Qi Huang and Jianguo Tang. Age-related hearing loss or presbycusis. European Archives of Oto-rhino-laryngology, 267(8) :1179–1191, 2010.
- Audrey Coll´ee, Jean-Baptiste Watelet, Hanne Vanmaele, Jozef Van Thielen, and Peter Clarys. Longitudinal changes in hearing threshold levels for noise-exposed military personnel. International archives of occupational and environmental health, 92(2) :219–226, 2019.
- George A Gates and John H Mills. Presbycusis. The Lancet, 366(9491) :1111–1120, 2005.
- Antonis Moukos, Dimitrios G Balatsouras, Thomas Nikolopoulos, Pavlos Maragoudakis, Evangelos I Yiotakis, Stavros G Korres, and Dimitrios Kandiloros. A longitudinal study of changes in distortion-product otoacoustic emissions and pure-tone thresholds in an industrial setting. European Archives of Oto-Rhino-Laryngology, 271(10):2649–2660, 2014.
- Kenneth S Henry, Mark Sayles, Ann E Hickox, and Michael G Heinz. Divergent auditory nerve encoding deficits between two common etiologies of sensorineural hearing loss. Journal of Neuroscience, 39(35) :6879–6887, 2019.
- Christa L Themann and Elizabeth A Masterson. Occupational noise exposure: A review of its effects, epidemiology, and impact with recommendations for reducing its burden. The Journal of the Acoustical Society of America, 146(5) :3879–3905, 2019.
- Katya Feder, David Michaud, James McNamee, Elizabeth Fitzpatrick, Hugh Davies, and Tony Leroux. Prevalence of hazardous occupational noise exposure, hearing loss, and hearing protection usage among a representative sample of working Canadians. Journal of occupational and environmental medicine, 59(1) :92, 2017.
- Deborah Imel Nelson, Robert Y Nelson, Marisol Concha-Barrientos, and Marilyn Fingerhut. The global burden of occupational noise-induced hearing loss. American journal of industrial medicine, 48(6) :446–458, 2005.
- Etienne G Krug. Hearing loss due to recreational exposure to loud sounds: a review. World Health Organization, 2015.
- World Health Organization et al. Occupational noise: assessing the burden of disease from work-related hearing impairment at national and local levels. Environmental burden of disease Series, (9) :1–33, 2004.
- Andrew W Smith et al. The world health organisation and the prevention of deafness and hearing impairment caused by noise. Noise and Health, 1(1) :6, 1998.
- Maria Hoff, Tomas Tengstrand, Andre´ Sadeghi, Ingmar Skoog, and Ulf Rosenhall. Improved hearing in Swedish 70-year olds—a cohort comparison over more than four decades (1971–2014). Age and ageing, 47(3) :437–444, 2018.
- Christina Tikka, Jos H Verbeek, Erik Kateman, Thais C Morata, Wouter A Dreschler, and Silvia Ferrite. Interventions to prevent occupational noise-induced hearing loss. Cochrane Database of Systematic Reviews, (7), 2017.
- Gerald J Joy and Paul J Middendorf. Noise exposure and hearing conservation in US coal mines—a surveillance report. Journal of Occupational and Environmental Hygiene, 4(1) :26–35, 2007.
- Nicholas Heyer, Thais C Morata, Lynne E Pinkerton, Scott E Brueck, Daniel Stancescu, Mary Prince Panaccio, Hyoshin Kim, J Stephen Sinclair, Martha A Waters, Cherie F Estill, et al. Use of historical data and a novel metric in the evaluation of the effectiveness of hearing conservation program components. Occupational and environmental medicine, 68(7) :510–517, 2011.
- Peter Rabinowitz, Linda F Cantley, Deron Galusha, Sally Trufan, Arthur Swersey, Christine Dixon-Ernst, Vickie Ramirez, and Richard Neitzel. Assessing hearing conservation program effectiveness. Journal of Occupational and Environmental Medicine, 60(1) :29–35, 2018.
- Workers’ Compensation Board of British Columbia. Industrial Health & Safety Regulations. Vancouver, BC : Workers’ Compensation Board of British Columbia, 1978.
- Workers’ Compensation Board of British Columbia. Occupational Health & Safety Regulations. Vancouver, BC : Workers’ Compensation Board of British Columbia, 1998.
- Thomas W Frederiksen, Cecilia H Ramlau-Hansen, Zara A Stokholm, Matias B Grynderup, A° se M Hansen, Jesper Kristiansen, Jesper M Vestergaard, Jens P Bonde, and Henrik A Kolstad. Noise-induced hearing loss–a preventable disease? results of a 10-year longitudinal study of workers exposed to occupational noise. Noise & health, 19(87) :103, 2017.
- Hugh Davies, Steve Marion, and Kay Teschke. The impact of hearing conservation programs on incidence of noise-induced hearing loss in Canadian workers. American journal of industrial medicine, 51(12) :923–931, 2008.
- Sasha Brown, Christian Gigu`ere, and Michael Sharpe. CSA z107. 6 audiometric testing for use in hearing loss prevention programs : A new title for a new edition. Canadian Acoustics, 44(3), 2016.
- R Core Team. R : A Language and Environment for Statistical Computing. R Foundation for Statistical Computing, Vienna, Austria, 2013.
- Katya P Feder, David Michaud, Pamela Ramage-Morin, James McNamee, and Yves Beauregard. Prevalence of hearing loss among Canadians aged 20 to 79 : Audiometric results from the 2012/2013 Canadian Health Measures Survey. Statistics Canada, 2015.
- Elisabeth Henderson, Marcia A Testa, and Christopher Hartnick. Prevalence of noise-induced hearing-threshold shifts and hearing loss among US youths. Pediatrics, 127(1) :e39–e46, 2011.
- William E Hodgetts, Jana M Rieger, and Ryan A Szarko. The effects of listening environment and earphone style on preferred listening levels of normal hearing adults using an mp3 player. Ear and hearing, 28(3) :290–297, 2007.
- Mario R Serra, Ester C Biassoni, Utz Richter, Gloria Minoldo, Graciela Franco, Silvia Abraham, Jorge A Carignani, Silvia Joekes, and Mar´ıa R Yacci. Recreational noise exposure and its effects on the hearing of adolescents. Part i : An interdisciplinary long-term study. International journal of audiology, 44(2) :65–73, 2005.
- Mario R Serra, Ester C Biassoni,Mar´ıa Hinalaf,Mo´nica Abraham, Marta Pavlik, Jorge Pe´rez Villalobo, Carlos Curet, Silvia Joekes, Mar´ıa R Yacci, Andrea Righetti, et al. Hearing and loud music exposure in 14-15 years old adolescents. Noise and Health, 16(72) :320, 2014.
- Kamakshi V Gopal, Liana E Mills, Bryce S Phillips, and Rajesh Nandy. Risk assessment of recreational noise–induced hearing loss from exposure through a personal audio system—ipod touch. Journal of the American Academy of Audiology, 30(07) :619–633, 2019.
- Lyndal Carter, Warwick Williams, Deborah Black, and Anita Bundy. The leisure-noise dilemma : hearing loss or hearsay? what does the literature tell us ? Ear and hearing, 35(5) :491–505, 2014.
- Colleen G Le Prell, Hannah W Siburt, Edward Lobarinas, Scott K Griffiths, and Christopher Spankovich. No reliable association between recreational noise exposure and threshold sensitivity, distortion product otoacoustic emission amplitude, or word-in-noise performance in a college student population. Ear and hearing, 39(6) :1057–1074, 2018.
- Hannah Keppler, Ingeborg Dhooge, and Bart Vinck. Hearing in young adults. Part ii : The effects of recreational noise exposure. Noise & health, 17(78) :245, 2015.
- PerMuhr, Ann-Christin Johnson, Bjo¨rn Skoog, and Ulf Rosenhall. A demonstrated positive effect of a hearing conservation program in the Swedish armed forces. International Journal of Audiology, 55(3) :168–172, 2016.
- Hugh W Davies, Kay Teschke, Susan M Kennedy, Murray R Hodgson, and Paul A Demers. A retrospective assessment of occupational noise exposures for a longitudinal epidemiological study. Occupational and environmental medicine, 66(6) :388–394, 2009.
- Sasha Brown. Unpublished data. n.d.
- LuAnn L Brink, Evelyn O Talbott, J Alton Burks, and Catherine V Palmer. Changes over time in audiometric thresholds in a group of automobile stamping and assembly workers with a hearing conservation program. AIHA Journal, 63(4) :482–487, 2002.
- Robert A Dobie. The burdens of age-related and occupational noise-induced hearing loss in the United States. Ear and hearing, 29(4) :565–577, 2008.
- Christina Hederstierna and Ulf Rosenhall. Age-related hearing decline in individuals with and without occupational noise exposure. Noise & health, 18(80) :21, 2016.
- International Standard Organization. Acoustics : Estimation of noise-induced hearing loss (iso-1999), 2013.
| Age (years) | Birth Cohort | N persons | % with hearing loss present | Chi-squared contingency test | Posthoc pairwise comparisons |
| 20 | 1960 | 2165 | 1.94% | Χ = 7.59, df = 3, p = .055 | |
| 1970 | 2326 | 2.06% | |||
| 1985 | 2496 | 1.32% | |||
| 1995 | 2322 | 1.25% | |||
| 30 | 1960 | 5167 | 3.37% | Χ = 8.51, df = 1, p = .004 | |
| 1985 | 3949 | 2.33% | |||
| 45 | 1935 | 1387 | 18.24% | Χ = 131.08, df = 2, p < .001 | 1935 vs 1960: Χ = 100.53, df = 1, p < .001 |
| 1960 | 4560 | 8.66% | 1935 vs 1970: Χ = 108.441, df = 1, p < .001 | ||
| 1970 | 3764 | 8.08% | 1960 vs 1970: Χ = 0.902, df = 1, p = .342 | ||
| 55 | 1935 | 2137 | 35.22% | Χ = 200.9, df = 1, p < .001 | |
| 1960 | 4160 | 18.99% |
Appendix A: Results of the chi-square analysis comparing prevalence of hearing loss across cohorts at each age. Post-hoc pairwise comparisons are given when appropriate to do so.
Appendix B: Observed threshold means (dB HL) by cohort and frequency for 45-year olds by occupation. Upper and lower 95% confidence intervals of the means are shown in square brackets
| Occupation | Cohort | N | 3000 Hz | 4000 Hz | 6000 Hz |
| Heavy equipment operator | 1980 test (1935 cohort) | 43 | 31.3 [24.2, 38.4] | 37.0 [30.8, 43.1] | 38.8 [32.4, 45.3] |
| 2015 test (1970 cohort) | 99 | 16.5 [13.4, 19.5] | 24.6 [21.2, 28.0] | 23.1 [20.0, 26.3] | |
| Front end loader/ forklift operator | 1980 test (1935 cohort) | 66 | 25.1 [21.6, 30.2] | 34.5 [30.1, 38.9] | 34.5 [29.1, 39.9] |
| 2015 test (1970 cohort) | 65 | 17.5 [13.8, 21.2] | 21.9 [18.6, 25.2] | 22.2 [18.4, 26.03] | |
| Heavy duty mechanic | 1980 test (1935 cohort) | 32 | 30.3 [22.4, 38.2] | 37.7 [29.3, 46.1] | 36.7 [28.7, 44.8] |
| 2015 test (1970 cohort) | 83 | 14.7 [11.9, 17.5] | 23.1 [19.7, 26.6] | 23.8 [20.3, 27.3] |
Appendix C: Thresholds and 95% confidence intervals for the 55-year olds in our sample. The ISO thresholds are calculated from the ISO 1999:2013(E) data set (see text for further details). The difference between ISO and our sample is calculated as the difference between the ISO threshold and either the upper or lower limit of the 95% CI from our sample. “Not different” indicates that ISO mean threshold fell within the 95% CI of our sample.
| Freq (Hz) | Cohort | N | Mean | sd | 95% CI [LL,UL] | ISO | Diff between ISO and our sample (dB) | Comparison relative to ISO |
| 500 | 1935 | 2124 | 12.3 | 11.3 | [11.8, 12.8] | 11 | -0.8 | Poorer than ISO by less than 5 dB |
| 1960 | 4158 | 10.7 | 9.8 | [10.4, 11.0] | 0 | Not different from ISO | ||
| 1000 | 1935 | 2124 | 12.8 | 12.6 | [12.3, 13.3] | 12.9 | 0 | Not different from ISO |
| 1960 | 4158 | 11.1 | 11 | [10.8, 11.4] | 1.5 | Better than ISO by less than 5 dB | ||
| 2000 | 1935 | 2124 | 19.3 | 18 | [18.5, 20.0] | 16.3 | -2.2 | Poorer than ISO by less than 5 dB |
| 1960 | 4158 | 13.2 | 12.8 | [12.8, 13.6] | 2.7 | Better than ISO by less than 5 dB | ||
| 3000 | 1935 | 2124 | 33.7 | 21.5 | [32.3, 34.6] | 21.3 | -11 | Poorer than ISO by more than 10 dB |
| 1960 | 4158 | 22.8 | 18 | [22.3, 23.3] | -1 | Poorer than ISO by less than 5 dB | ||
| 4000 | 1935 | 2124 | 42.1 | 21.2 | [41.2, 43.0] | 27.1 | -14.1 | Poorer than ISO by more than 10 dB |
| 1960 | 4158 | 30.9 | 19.1 | [30.3, 31.5] | -3.4 | Poorer than ISO by less than 5 dB | ||
| 6000 | 1935 | 2124 | 43.9 | 21.8 | [43.0, 44.8] | 26.4 | -16.6 | Poorer than ISO by more than 10 dB |
| 1960 | 4158 | 32.9 | 19.4 | [32.3, 33.5] | -5.9 | Poorer than ISO by more than 5 dB | ||
| 8000 | 1935 | 2124 | 41.4 | 23 | [40.4, 42.4] | 33.3 | -7.1 | Poorer than ISO by more than 5 dB |
| 1960 | 4158 | 35.3 | 21.5 | [34.6, 36.0] | -1.3 | Poorer than ISO by less than 5 dB |