
Automatic Interpretation of Pure-Tone Audiograms


From the Labs to the Clinics
Renowned auditory researcher Dr. Robert Harrison brings us up to date on information and research from the Labs. Appropriately titled “From the Labs to the Clinics”, Bob is involved in laboratory and applied/clinical research, including evoked potential and otoacoustic emission studies and behavioural studies of speech and language development in children with cochlear implants. For a little insight into Bob’s interests outside the lab and the clinic, we invite you to climb aboard Bob’s Garden Railway.
Using AI Deep-Learning Methods
Back in the day, when audiology was in its infancy and electronic acoustic signal generation became possible, there was an important quest: to determine pure-tone hearing thresholds for “normal” subjects. Defining normal hearing thresholds was the prerequisite for diagnosing any hearing loss. Average pure-tone hearing thresholds from “normal” hearing subjects were measured in scores of studies. The story goes that early large-scale threshold testing was conducted on normal-hearing volunteers at US county fairs (see the data labeled “5 Audiometric surveys” in Figure 1 below). Other studies were made in more controlled lab environments. In any case, thousands of normal-hearing thresholds were determined, and these data formed the 0 dB hearing-loss line on the standard audiogram.
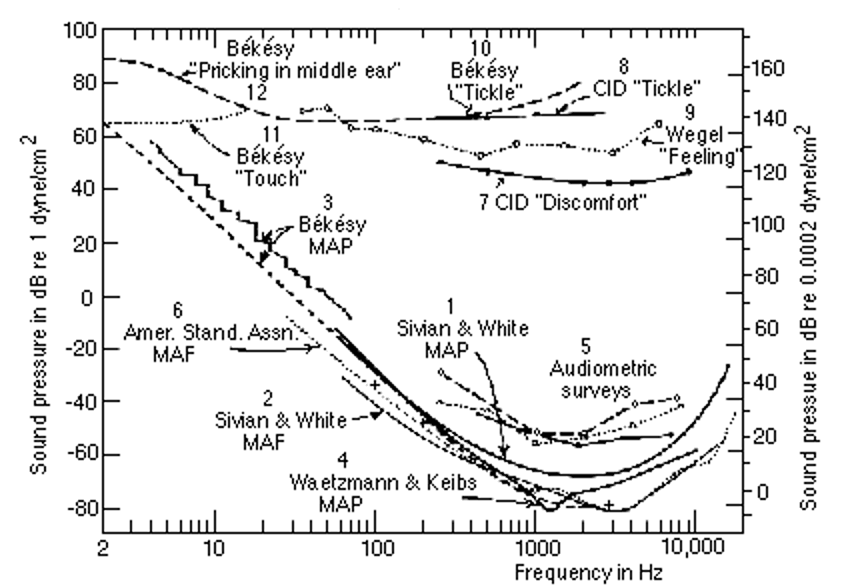
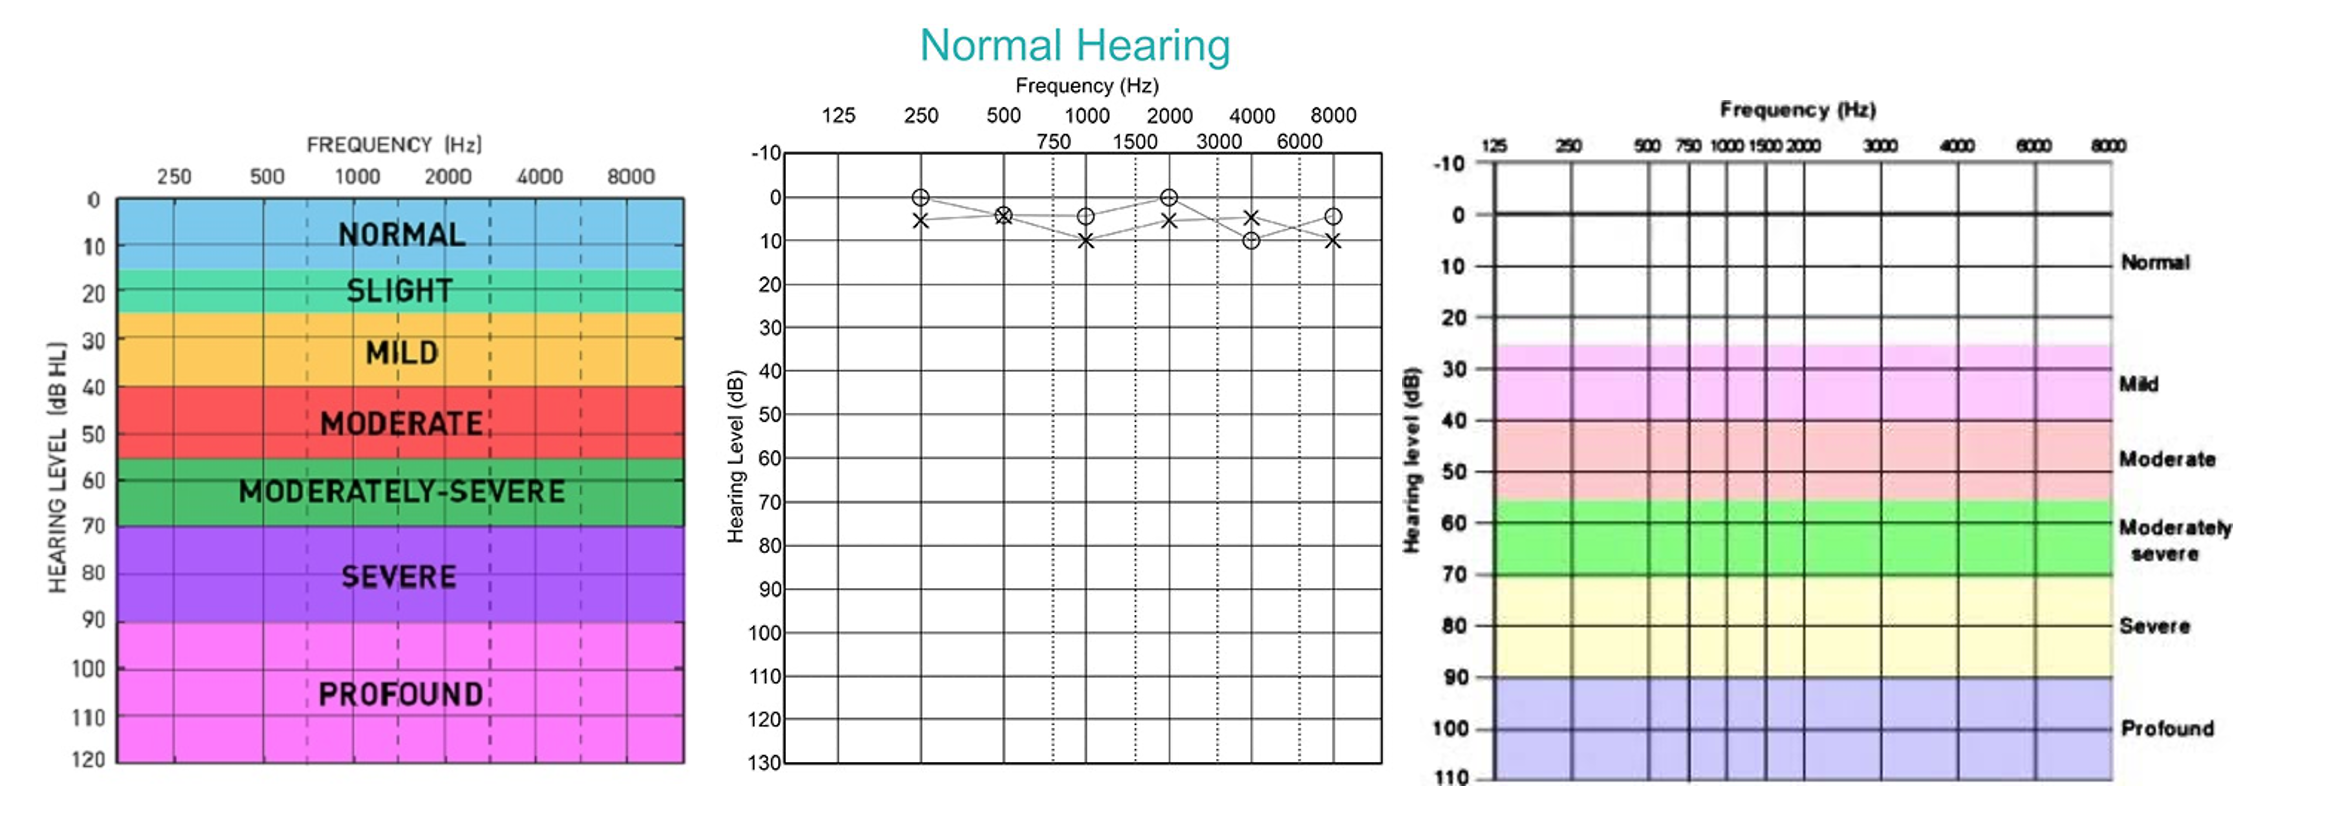
Of course, the 0dB audiometric standard was continually refined as improved electroacoustic devices were developed and as the criteria for normal hearing conditions were strengthened (e.g., by controlling for subject age, bilateral vs. unilateral testing, free-field vs. closed-field testing, ambient noise levels, etc.). Some readers (maybe older ones) may be familiar with figure 1, which illustrates how many sources of data were assembled to determine pure-tone thresholds across our hearing frequency range. That hearing-audibility curve in dB sound pressure level was then normalized to represent 0dB hearing loss on the standard audiogram (as in Figure 2).
For almost a century, since the seminal publication in 1933 by Sivian and White [ref 2], the audiogram has been the standard tool in audiology for defining hearing loss and, in large part, for helping determine etiology. Of course, we now have many other diagnostic tests and tools available, but most audiologists would agree that the audiogram is their key starting point. The pattern of hearing loss across frequency has become the mainstay for diagnostic purposes (especially when considering both air- and bone-conduction thresholds); however, there has always been a somewhat subjective interpretation of the audiogram. Many projects to classify audiometric patterns to “standardize” diagnostic interpretation have been proposed, mostly involving averaging a wide range of audiometric profiles and associated etiologies.
With the advent of artificial intelligence (AI) and deep learning models, there is potential to combine large numbers of audiometric datasets and categorize the various patterns of audiograms according to the degree of hearing loss and etiology. New patient audiograms can then be correlated with those classified in a massive database. Several research teams have implemented different deep learning techniques for audiogram classification. The immediate clinical goals are, for example, to “accurately classify audiograms into various hearing loss categories” and “reduce the misdiagnosis rate of hearing conditions”. [ref 3]. Another research team [ref 4] has the relatively modest aim of enabling untrained persons (i.e., not audiologists or ENTs) to interpret audiometric data.
I want to give a shout-out to a Canadian-led research team that is pioneering the use of AI-based methods for diagnostic interpretation of the audiogram [ref 5]. Based at the University of Toronto (Otolaryngology HNS and Mechanical and Industrial Engineering) and Duke University (Otolaryngology HNS) the group has recently developed an “AutoAudio” protocol/device that “accurately and quickly interprets diagnostic audiograms”.
Thus far, progress in using deep learning in audiology has largely focused on automatic interpretation of the audiogram. This will provide untrained individuals an accurate but superficial interpretation of the audiogram. It is not clear that it will be more accurate than that achieved by an experienced audiologist. I hope that in the future we can train the AI systems with much more than just the audiogram. We could add in electrophysiological data, otoacoustic emission findings, other psychoacoustic test results, speech test data etc. For future progress in deep learning algorithms, much will depend on the quality and veracity of the data used in AI training sets. As is becoming increasingly obvious today (in politics), deciding what constitutes the facts, statistically significant data, or real evidence can be a challenge! We should all bear in mind that adage about the performance of computer systems in general: “garbage in, garbage out”.
References
- Stevens S. S., & Phillips L. (1951). Handbook of. Experimental Psychology.
- Sivian L.J. and White S.D.: On minimum audible sound fields (1933) J. Acoust. Soc. Am. 4, 288–321 (1933) https://doi.org/10.1121/1.1915608
- Dou, Z., Li, Y., Deng, D., Zhang, Y., Pang, A., Fang, C., Bai, X. and Bing, D., 2024. Pure tone audiogram classification using deep learning techniques. Clinical Otolaryngology, 49(5), pp.595-603. https://doi.org/10.1111/coa.14170
- Tbini, M. and Ben Salah, M. (2025) Deep learning for automatic interpretation of pure‑tone audiometry using InceptionV3. The Egyptian Journal of Otolaryngology (2025) 41:144 https://doi.org/10.1186/s43163-025-00907-2
- Crowson, M.G., Lee, J.W., Hamour, A. et al. (2020) AutoAudio: Deep Learning for Automatic Audiogram Interpretation. J Med Syst 44, 163 (2020). https://doi.org/10.1007/s10916-020-01627-1