Industry Research: Clinical Comparison of Premier Hearing Aids

In the past 5 years we have witnessed several important changes regarding how hearing aids function, and how they are marketed. Bluetooth connectivity is now a standard feature and is something that is expected by many patients. Rechargeable hearing aids rapidly are becoming the norm rather than the exception. Motion sensors can be used to help optimize signal processing. And certainly, remote programming and other Telecare features are changing the way post-fitting care is delivered.1 But when patients nominate their top three or four fitting goals on the COSI (Client Orientated Scale of Improvement),2 it’s unlikely that any of the above features will be listed as #1, or maybe even listed at all. What will be listed as #1 for nearly all patients is improved speech understanding in background noise—something that hasn’t changed for decades.
So, while all the new algorithms and features give us something new to talk about and something new to market, we cannot forget about the fundamental goal of optimizing speech understanding. In general, obtaining excellent processing for understanding speech involves factors such as the frequency-specific gain and output, compression characteristics, and the sophistication of the digital noise reduction (DNR) and directional technology. Hearing aid manufacturers approach each of these factors somewhat differently.
Research has revealed that while there are many variables that determine how each audiologist selects his or her “favorite brand” of hearing aid, the leading reason is best technology.3 Hence, it is important to systematically compare different popular products to determine if they are all the same, or if some are better than others? For example, in 2016, a major manufacturer stated that they had developed a new speech-enhancement algorithm which “exceeds and supplants traditional directionality and noise reduction protocols.” Given that this technology was introduced about the same time as the Signia primax, it seemed reasonable to compare this new product to the primax in head-to-head competition. A clinical study, using speech-in-noise recognition testing (the American English Matrix Test; AEMT), was conducted by independent researchers at the Western National Centre for Audiology, London, Ontario.4 The results showed that Brand A’s new technology fell significantly below the performance obtained with the Signia instruments (SNR difference =1.5 dB; p=.005). Individual data are displayed in Figure 1. Note that 16 of the 20 subjects performed the best with the Signia product; 8 participants (40%) had an SNR advantage of 2 dB or greater between products, and, in all 8 cases, the advantage was for Signia.
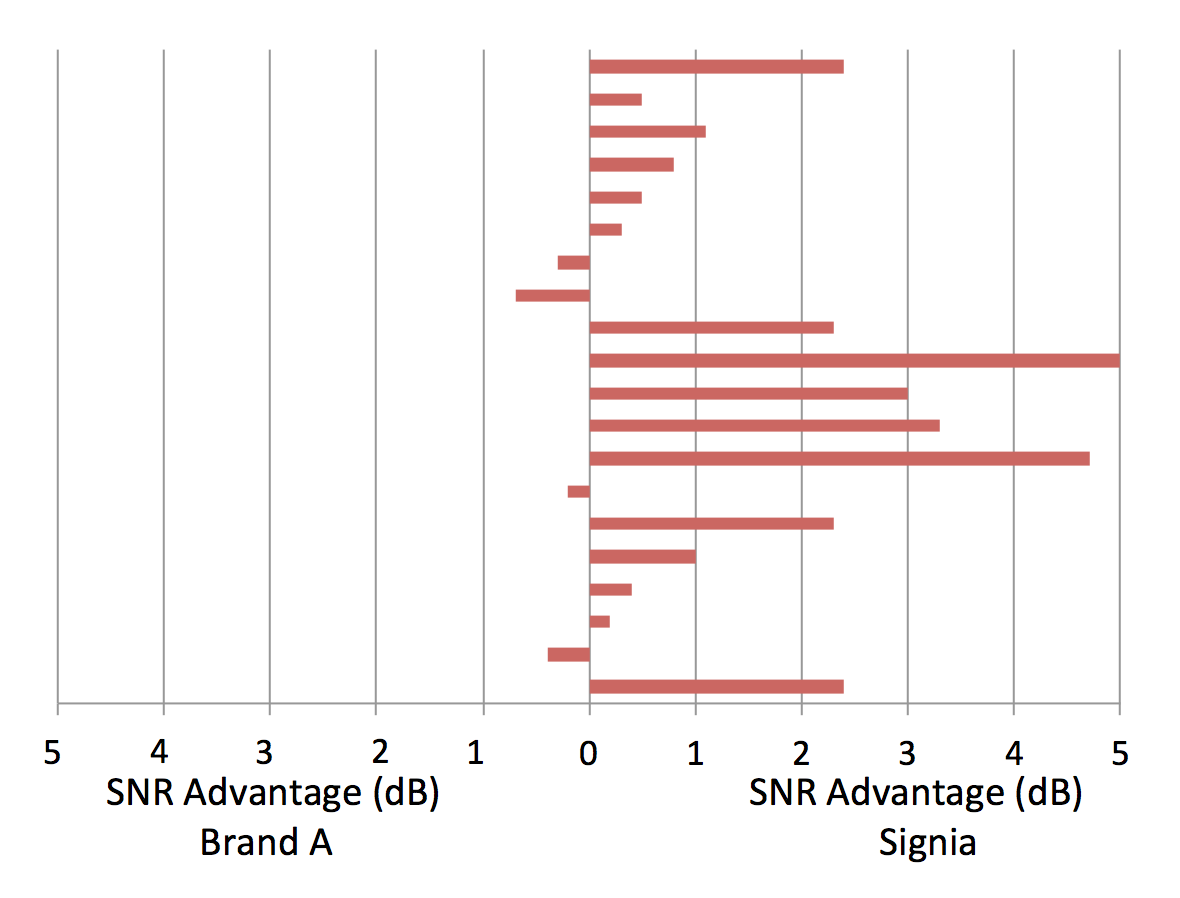
Figure 1. Individual distribution of performance on the AEMT for the 20 participants. Directional of bars indicates dB SNR advantage for Brand A vs. Signia. Adapted from Littmann and Hoydal, 2017.
Since the time of the study above, Brand A has introduced new technology which reportedly provides better speech understanding in background noise than the previous product. Another major manufacturer, which we’ll refer to as Brand B, also recently introduced a new model of their premier hearing aid, marketed as providing “exceptional speech understanding in noisy environments.” The premier hearing aid of Signia is now the Nx, introduced in 2018, rather than the primax platform used in the previous research. With these recent changes, it is of scientific interest to conduct another head-to-head study of these three products from leading manufacturers.
Study Design
The research was conducted at the University of Northern Colorado, Greeley, Colorado, under IRB approval. Individuals meeting the selection criteria were recruited from the clinic files, and were paid for their participation.
Participants
A total of 18 adults (9 males, 9 females) participated in this study. Participant ages ranged from 61-86 years with an average age of 72.6 years; all were experienced users of bilateral amplification. All had symmetrical downward sloping sensorineural hearing losses, with a mean audiogram ranging from a 28–37 dB loss in the lower frequencies (250 to 1000 Hz), to a mean 56–61 dB impairment in the high frequencies (3000 to 6000 Hz). All testing was conducted with the participants aided bilaterally.
Hearing Aids
The hearing aids used in the study were the premier mini-BTE RIC hearing aids (May, 2019) of Signia (Nx Pure), Brand A and Brand B, programmed using the corresponding software. The hearing aids were fitted with each manufacturer’s recommended closed-fitting eartip. For each participant, all instruments were programmed to NAL-NL2 (experienced user, bilateral fitting), verified with probe-microphone measurements within +/-5 dB of prescriptive targets from 500 to 4000 Hz.
As will be outlined in detail later in this article, both objective and subjective measures were conducted. The first part of the testing was speech recognition measures in three different noise backgrounds. The second part of the testing was subjective ratings for different attributes of the listening experience. The hearing aids were programmed differently for the speech recognition measures vs. the subjective ratings.
For the speech recognition task, each manufacturer’s product was programmed to the specific setting recommended for loud speech in loud noise. The assumption was that both directionality and DNR would be at the most aggressive settings, thus providing the best speech recognition of the target speech signal. For the subjective ratings, the hearing aids were set to each manufacturer’s recommended default program for everyday listening. In this case, the configuration of the directionality and the strength of the DNR was determined by the instrument’s signal classification system. Given that the cafeteria noise used for this testing would likely be classified as “noise,” and the overall level was 74 dB SPL, it’s possible that the resulting directional and DNR settings for the subjective judgments were the same as that programmed for the speech recognition measures.
Procedures
Testing was conducted in an audiometric test suite. The array for the presentation of the target and competing speech material consisted of 8 loudspeakers surrounding the participant, equally spaced at 45° increments, starting at 0° (i.e., 45°, 90°, 135°, etc). The participant was seated 1.5 meters from all loud speakers in the center of the room, directly facing the target speech signal at 0°. The target speech material for the speech recognition measures was the sentences of the AEMT.5 The AEMT software was used for scoring; 20 sentences for each condition using a 50% correct criterion (SRT-50). Three different background noises were used, specifically selected to vary in intensity, spectrum and degree of informational masking. The noises were as follows (dBA levels represent overall output of the seven loudspeakers measured at the position of the head of the participant):
- Traffic noise presented at 78 dBA
- Cafeteria noise (no identifiable speech) presented at 74 dBA.
- Competing talkers presented at 68 dBA. The competing talkers were sentences of the AEMT presented uncorrelated from the seven surrounding loudspeakers.
Each participant was tested consecutively with the same product for the three different noise conditions. The order of the noise condition was counterbalanced, as was the ordering of the three different hearing aid brands.
The loudspeaker array for the subjective testing was the same as for the speech recognition measures. For these judgements, the primary signal was a man and a woman having a conversation at a party. The background competition (overall level 74 dB SPL; SNR= -2 dB), presented uncorrelated from the seven surrounding speakers, was a cocktail party babble, with occasional discernable words. The participants listened to a 10 second sample, and after each sample were asked to make a judgment regarding an attribute of the listening experience. Judgements were made for the three following statements:
- The speech of the primary talkers was clear.
- The primary talkers and background noise sounded natural.
- The listening experience was realistic.
The ratings were made on a 1 to 7 (13-point) scale with 1=Completely Disagree and 7=Completely Agree. The ratings of the different attributes were conducted in the order shown above; the ordering of the different products was counterbalanced.
Results
This study consisted of the comparison of the premier hearing aids from three major manufacturers. Speech recognition was evaluated using an adaptive approach for three different competing noises. Subjective judgments for speech in background noise were conducted for three different attributes of the listening experience.
Speech Recognition
The sentences of the AEMT, scored for SRT-50, were presented in three different background noises: traffic noise, cafeteria noise and competing talkers. Speech levels of the SRT-50 (dB SPL) were analyzed using repeated measures analysis of variance (RM-ANOVA) with two within-subject factors: noise type (traffic, cafeteria, competing talkers) and brand (Signia, Brand A, Brand B). Results revealed a significant main effect of noise type (F2,16 = 7.43, p < 0.01, ŋp2 = 0.48) and a significant main effect of brand (F2,16 = 6.28, p < 0.05, ŋp2 = 0.44). The brand by noise interaction was not significant (p = 0.53). These results revealed differences in signal level across brands and noise types, but the differences between brands were independent of noise type. That is, one brand was superior for all noise types.
Pairwise comparisons controlling for family-wise error rate using Bonferroni adjustments were used to explore the significant main effects of noise and brand. For noise, results revealed levels (SRT-50) were significantly higher (worse) with the babble relative to the cafeteria noise (M difference = 1.44, 95%CI: 0.46 to 2.43). Differences between babble and traffic noise were not significant (M difference = 1.10, 95% CI: -0.23 to 2.43); neither were differences between traffic and cafeteria noises (M difference = 0.35, 95% CI: -0.59 to 1.29).
For brand, pairwise comparisons revealed SRT-50 levels were significantly lower (better) with Signia than with Brand A (M difference = −1.11 dB, 95%CI: −2.44 to −0.07) and significantly lower (better) with Signia than with Brand B (M difference = -1.35 dB, 95%CI: -2.41 to -0.30). Differences in SRT-50 levels between Brand A and Brand B were not significant (M difference = 0.25 dB, 95%CI: -0.81 to 1.30).
The significant differences between Signia and the other two Brands can be observed in Figure 2, plotted here in SNR rather than the absolute SPL for the SRT-50. Three very different background “noises” were specifically selected, as it is possible that a given product might perform better for one type of background competition vs. another. In addition, the different types of noises reflect the variety of difficult listening situations that might be experienced by hearing aid users in the real world, making the findings more generalizable. The selected intensity levels varied by 10 dB (in dBA), as again, different systems may adjust noise management differently as a function of the overall input level. As reported, however, the type of background noise did not influence the significant advantage provided by the Signia instruments (see Figure 2). There was not a significant brand by noise interaction.
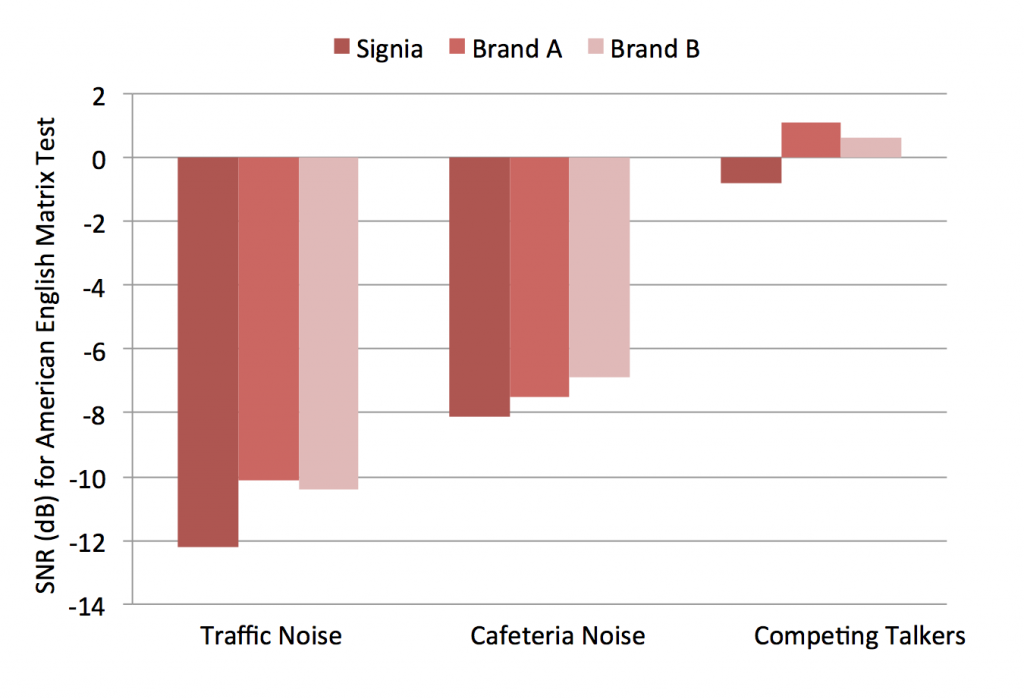
Figure 2. Mean SNRs for Signia, Brand A and Brand B for the AEMT sentences with three different background noise conditions. A significant advantage (p<.05) was observed for Signia across noise conditions.
While the type of background noise did not impact the relative differences among products, we do see large differences in the resulting SNRs. Notice that the SNRs for traffic noise are 10-11 dB lower (better) than those for the competing-talker background, and these differences are fairly consistent among products. We believe this is due to some combination of three factors: (1) the similarity of the spectrum of the background noise to the primary signal—energetic masking will be greatest when the spectra are the same; (2) the effectiveness of the DNR on the background signal—a true noise signal likely will be reduced more than one identified as speech-in-noise; and (3) the degree of informational masking in the competing signal, which varied greatly for the different signals.
Subjective Judgements
It has sometimes been stated in the literature that signal processing geared to optimizing speech recognition may have a negative effect on the overall perception of the acoustic scene. It has been suggested that for the listening experience to be perceived as natural and realistic there must be an open acoustic landscape. Because of these possible issues, subjective judgements for three different attributes of the listening experience were included: Was the signal clear? Did the signal sound natural? Was the listening experience realistic?
The results of these ratings revealed mean findings and standard deviations for the three different brands that were very similar. In general, the mean values (using the 1- to 7-point rating scale) centered on 4.6 for clearness, 5.3 for natural sounding, and 5.3 for realistic listening, with a difference no greater than 0.3 between the top rated and lowest rated product for any of the three conditions. Statistical analysis revealed no significant differences among products, with p values of 0.97 for clearness, 0.55 for naturalness, and 0.75 for realistic listening. It appears, therefore, that the processing that led to improved speech recognition did not have a negative effect on the listening experience.
Summary and Conclusions
As mentioned, research reveals that “best technology” is the leading factor regarding how audiologists choose their go-to hearing aid manufacturer (Johnson et al, 2009).3 Often, this decision is loosely based on manufacturer-specific information, anecdotal reports from patients, or comments on social media. Given that audiology is an evidence-based practice, it is only reasonable to look toward independent research when decisions of this degree of importance are made.
Our study placed the premier hearing aid products from three leading manufacturers in head-to-head competition. For the speech recognition measures, the Signia product was significantly superior, and this was true for three different background noise conditions. Subjective judgements for different attributes of the listening experience were equal for the three products, suggesting that superior speech understanding can be achieved without causing negative effects regarding the acoustic environment.
References
- Jorgensen L, Van Gerpen T, Powers TA, Apel D. Benefit of using telecare for dementia patients with hearing loss and their caregivers. Hear Rev 2019;26(6):22–25.
- Dillon H, James A, Ginis J. Client Oriented Scale of Improvement (COSI) and its relationship to several other measures of benefit and satisfaction provided by hearing aids. J Am Acad Audiol 1997;8:27–43.
- Johnson EE, Mueller HG, Ricketts TA. Statistically derived factors of varied importance to audiologists when making a hearing aid brand preference decision. J Am Acad Audiol 2009;20(1):40–8.
- Littmann V, Høydal E. Comparison study of speech recognition using binaural beamforming narrow directionality. Hear Rev 2017;24(5):34–37.
- Kollmeier B, Warzybok A, Hochmuth S, Zokoll MA, Uslar V, Brand T, Wagener KC. The multilingual matrix test: principles, applications, and comparison across languages: a review. Int J Audiol 2015;54(Suppl 2):3–16.