Optical Coherence Tomography of the Middle Ear

In the clinic, conductive hearing loss is diagnosed almost entirely based on behavioural and functional audiometric testing including air-bone audiometry and tympanometry, but for those patients who go on to have middle ear surgery, final diagnosis in the operating room is primarily achieved through microscopic exploration of the middle ear space once the tympanic membrane has been cut and lifted out of the way. It would be very useful to have access to high-quality images of the middle ear space in the clinic to make sure the diagnosis was correct before proceeding to surgery, but the opacity of the eardrum prevents middle ear structures from being visualized.
An emerging imaging technology called Optical coherence tomography (OCT) may hold the key to allowing microscope-like images of the middle ear space without the need to remove the tympanic membrane.1,2 OCT is capable of seeing through the tympanic membrane to produce depth-resolved images of the ear similar to ultrasound while using only safe, non-ionizing light to the image. As a bonus, it is capable of measuring the motion of ear structures in response to sound, a new diagnostic capability with great promise for understanding where fixations and discontinuities that lead to conductive hearing loss occur in the ear. Our lab has developed the first fully-integrated, clinical system for allowing OCT to be used to image the middle ear in the clinic and has begun studying the use of the new technology for screening primary conductive hearing loss patients in the ear nose and throat (ENT) clinic at the Nova Scotia Hospital Authority.OCT works by processing light reflected from structures at different depths in tissue. In ordinary imaging, light from all depths superimposes on the camera. In OCT, optical interferometry is used to determine the depth from which each reflection originated by so that at each point on the surface of the eardrum we obtain a depth-resolved map of the reflectivity of all structures behind it. The imaging point is scanned over the surface of the tympanic membrane to build up a 2-D or 3-D image of the middle ear volume. The same interferometric techniques that provide this depth information can also be used to measure the periodic motion of structures in response to sound. Such motions produce changes in the optical phase of the reflected light that is detecting using the same interferometric measurement used to produce the images. With OCT it is possible to measure the motion of structures with a sensitivity of better than 1 nm, corresponding roughly to the motion generated by 60dBSPL sounds in normal ears.Figure 1 shows typical images of a normal ear obtained with our system and compares them to a microscopic image obtained of an ear in surgery during exploratory tympanotomy. While OCT is limited to visualizing those parts of the middle ear visible along line-of-sight down the ear canal, we typically see the malleus, incus, incudostapedial joint, stapedius tendon, tensor tympani, chorda tympani, and cochlear promontory. In some patients, we can also see the arch of the stapes, the round window, and the oval window.
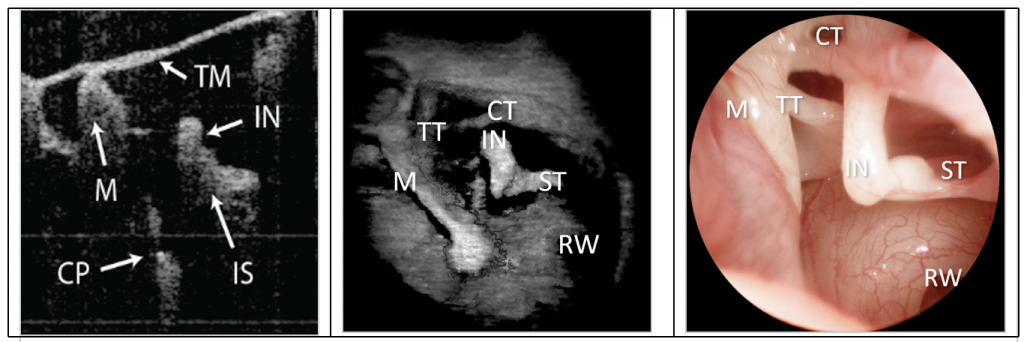
Figure 1. Middle ear images taken with OCT and with surgical microscopy. From left to right: 2D OCT image of a depth-resolved slice through the tymanic membrane, 3D OCT image of the middle ear space and transcanal surgical microscope image of the middle ear after the tympanic membrane has been cut and lifted away in exploratory tympanotomy. The labelled structures are tympanic membrane (TM), malleus (M), incus (IN), incudostapedial joint (IS), cochlear promontory (CP), tensor tympani (TT), chorda tympani (CT) and stapedius tendon (ST)
Figure 2 shows how the vibrometric information about the motion of middle ear structures in response to sound can be used diagnostically. A 90dB SPL, 1000Hz tone is played into the ear for two seconds and the motion along a line through the incus is measured. This motion is shown as a colour along the imaging line. In a patient with normal hearing, the motion of 70 nm is observed. In an otosclerotic patient the motion of the incus is below 10 nm and in a patient with an ossicular discontinuity at the incudostapedial joint the motion is above 100 nm. The information provided is similar to what can often be inferred from tympanometry, but it is spatially specific and so can potentially provide greater certainty about the location of the functional lesion that causes a conductive loss. It is also much more sensitive to fixations along with the distal parts of the ossicular chain since it can measure at the location of the fixation.3
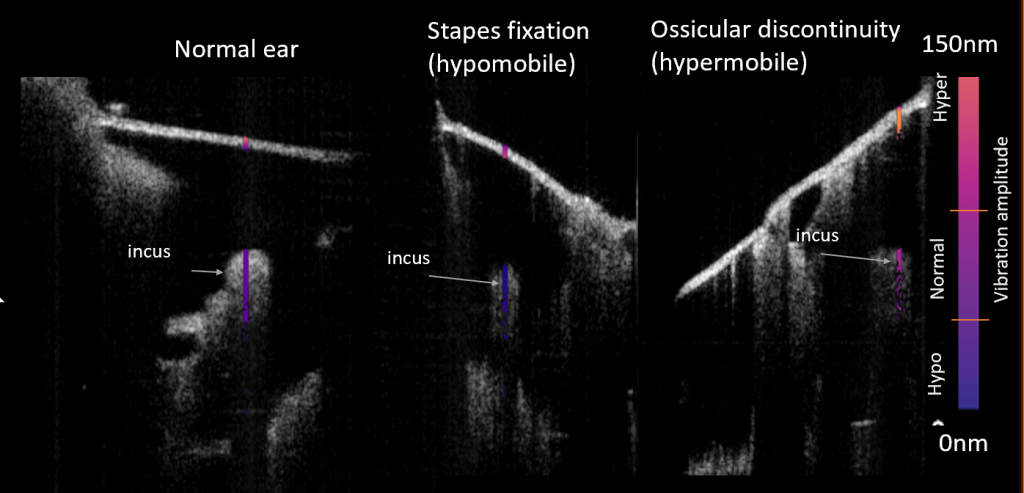
Figure 2 Measurement of the vibration of middle ear structures in response to sound. We measure at the incus in patients with a normal middle ear (left), otosclerotic stapes fixation (middle) and ossicular discontinuity (right)
While conductive hearing loss is easy to distinguish from sensorineural loss using conventional approaches, clinicians often struggle to understand exactly what the cause of conductive loss is in individual patients. In patients with multiple sources of loss (e.g., a perforation and ossicular fixation), ambiguous tympanometric results, traumatic injuries to the middle ear or conductive loss that recurs after surgery, OCT may be able to provide new diagnostic insight that can improve the quality of care. Even in patients for which a diagnosis can be achieved without it, there is a great appeal in having images that can confirm diagnostic hypotheses, help with surgical planning and allow clinicians to explain to patients exactly what is wrong with their middle ear and how it can be fixed. While still in its technological infancy, middle ear OCT offers a compelling new set of diagnostic capabilities that could change the way middle ear disease is diagnosed. We expect to learn much over the coming years about exactly how OCT can be integrated into current clinical practice and how to best make use of the new diagnostic information that it provides.
References
- MacDougall D, Farrell J, and Brown J, et al. Long-range, wide-field swept-source optical coherence tomography with GPU accelerated digital lock-in Doppler vibrography for real-time, in vivo middle ear diagnostics. Biomed Opt Express 2016;11:4621.
- Tan HEI, Santa Maria PL, Weijesinghe P, et al. Optical coherence tomography of the tympanic membrane and middle ear: A review. Otolaryngol Head Neck Surg Off J Am Acad. Otolaryngol-Head Neck Surg 2018;Sep;159(3):424-438. doi: 10.1177/0194599818775711.
- MacDougall D, Morrison L, Morrison C et al. Optical coherence tomography doppler vibrometry measurement of stapes vibration in patients with stapes fixation and normal controls. Otol Neurotol. 2019 Apr;40(4):e349-e355. doi: 10.1097/MAO.0000000000002193.